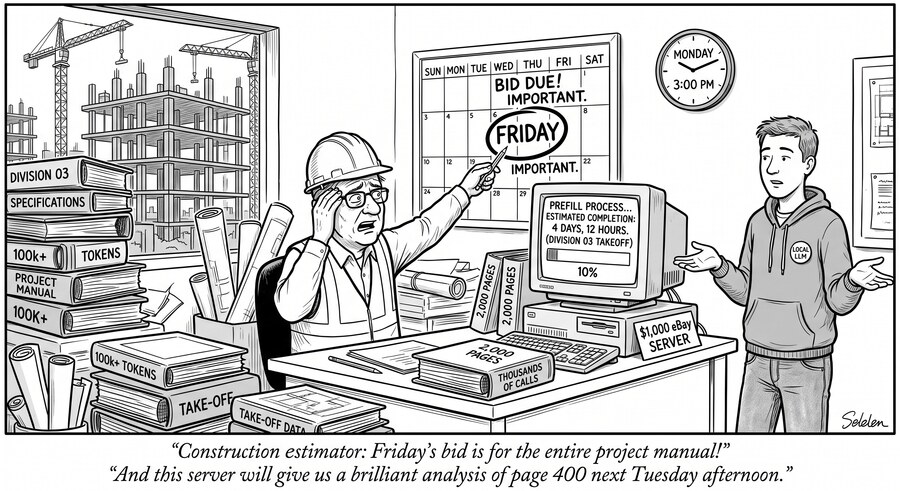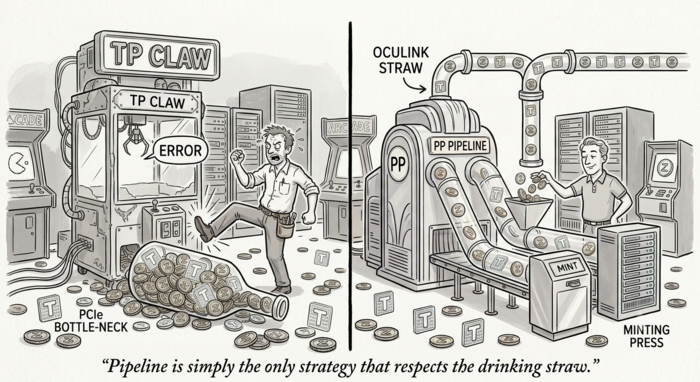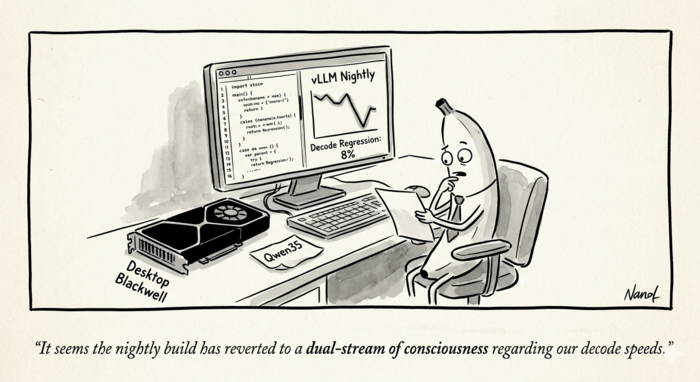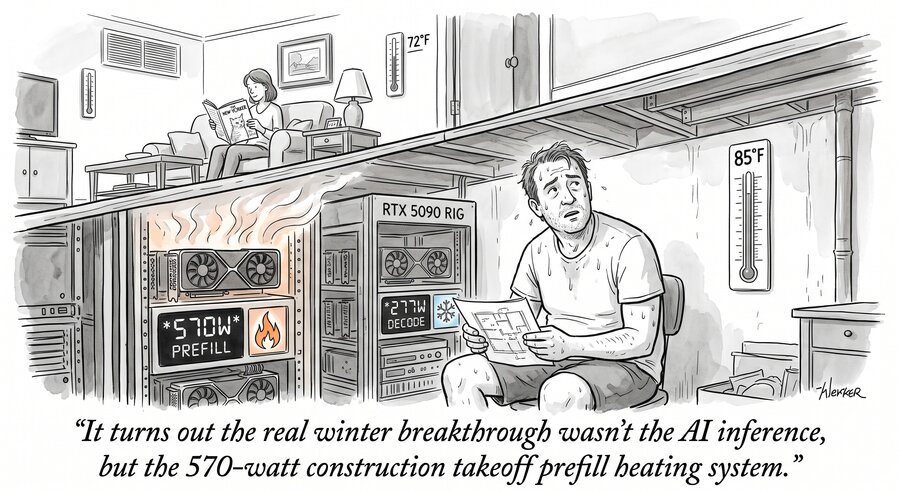
<?xml version="1.0" encoding="utf-8"?><?xml-stylesheet type="text/xml" href="https://joshua8.ai/feed.xslt.xml"?><feed xmlns="http://www.w3.org/2005/Atom" ><generator uri="https://jekyllrb.com/" version="4.3.4">Jekyll</generator><link href="https://joshua8.ai/feed.xml" rel="self" type="application/atom+xml" /><link href="https://joshua8.ai/" rel="alternate" type="text/html" /><updated>2026-08-17T23:14:45+00:00</updated><id>https://joshua8.ai/feed.xml</id><title type="html">Joshua8.AI</title><subtitle>A founder-led AI venture studio — we build and back AI companies from our own technical and hardware lab.</subtitle><entry><title type="html">Prefill Heats the House, Decode Doesn’t</title><link href="https://joshua8.ai/prefill-heats-house-gpu-furnace-winter/" rel="alternate" type="text/html" title="Prefill Heats the House, Decode Doesn’t" /><published>2026-08-17T00:00:00+00:00</published><updated>2026-08-17T00:00:00+00:00</updated><id>https://joshua8.ai/prefill-heats-house-gpu-furnace-winter</id><content type="html" xml:base="https://joshua8.ai/prefill-heats-house-gpu-furnace-winter/"><![CDATA[<p><img src="/images/prefill-gpu-furnace.jpg" alt="Cartoon: a cutaway of a house. Upstairs, a woman reads comfortably at 72°F. Downstairs in the basement, a sweating man sits at 85°F beside an RTX 5090 rig whose two panels read &quot;570W PREFILL&quot; with a flame icon and &quot;277W DECODE&quot; with a snowflake, while heat rises through the floor. Caption: &quot;It turns out the real winter breakthrough wasn't the AI inference, but the 570-watt construction takeoff prefill heating system.&quot;" /></p>

<p><em>Part of the space heater series — <a href="/quantization-nvidia-space-heaters/">Friday Morning Space Heaters</a>, <a href="/local-inference-breakeven-part1/">the breakeven posts</a>, <a href="/does-ai-agree-with-itself/">Does AI Agree With Itself?</a> — and a follow-on to <a href="/qwen38-27b-three-boxes-prefill/">Qwen3.8-27B on Three Boxes</a>.</em></p>

<p>Back in January I ended a post about quantization with a throwaway line: “These NVIDIA space heaters have been great this winter, but I’m beginning to wonder how they’re going to work out in the spring. Oh well, a problem for a few months from now.”</p>

<p>It is now the middle of August. It is a few months from now.</p>

<p>The answer, which I could have gotten any time since May by walking down the stairs with a thermometer, is that the basement has been sitting at <strong>80°F</strong> and touching <strong>85°F</strong> on heavy LLM days. Not dangerous. But it’s the room the whole lab lives in, and I spent four months not measuring it, because in January the heat was the feature.</p>

<h2 id="tldr">TL;DR</h2>

<p>The basement has no HVAC zone of its own. The thermostat that governs it reads a sensor one floor up, so GPU heat is never counted where it’s made — it’s 80°F down there right now.</p>

<p>Measuring that turned up something better. On an otherwise unloaded RTX 5090, sustained prefill pulls <strong>570W</strong>, pinned against the card’s 575W limit. Decode on the same card and model pulls <strong>277W</strong> — under half, though both report 99% “utilization.” Batching decode four ways only reached 315W.</p>

<p>The wrinkle is architectural: a sparse MoE with 3B active parameters is the weakest heat load in the building, while prefill lights up the whole card regardless.</p>

<p>So prefill-heavy work is winter work, and <a href="https://teracontext.ai">TeraContext</a> spec takeoff — 100k-token windows, thousands of calls, short answers — is the best furnace we own. It’s also why the rack isn’t in Ashburn: at 109 W/U my density is low enough that colo bills me for floor space, not power — $900 to $1,100 a month against ~$50 metered at 15% duty.</p>

<h2 id="the-room-has-no-vote">The room has no vote</h2>

<p>Here’s the actual defect, and it isn’t the GPUs.</p>

<p>The basement doesn’t have its own HVAC zone. It’s conditioned as an afterthought off the first-floor zone, and that zone’s thermostat reads a sensor in a hallway one floor up. I can put 2,400W of Blackwell into that room and the thermostat’s opinion of the house does not change by a tenth of a degree. It’s a furnace with no feedback path.</p>

<p>In winter that’s tolerable, and it’s most of why the January posts worked. Heat leaks up through the floor into the family room, which is where <a href="/local-inference-breakeven-part1/">the breakeven post</a> described the rack as “positioned strategically under the family room.” That was not strategy. That’s where the electrical panel is. But it worked: my wife got a warm family room, I got benchmark data, and the oil company got nothing.</p>

<p>In summer the same physics runs backward. The heat still leaks upstairs, where the first-floor zone fights it with air conditioning using a sensor that can’t see the source, while the basement climbs because nothing in the control system is accountable for it. Two seasons, one missing sensor, opposite outcomes.</p>

<h2 id="what-the-card-actually-draws">What the card actually draws</h2>

<p>One card was quiet this afternoon, so I sampled power and temperature while driving it through different load shapes. I’ve been benchmarking this rack for eight months and had somehow never once written down watts.</p>

<p>There are two 5090s in the basement and they aren’t the same card. One is a 600W board inside the Ryzen box. The other — the one I measured — is a 575W card in its own enclosure, attached to a host rather than installed in it, with its limit fixed at 575W floor and ceiling both. The other two GPUs on that host were parked at 0%, so nothing on that machine is contaminating the numbers. The 600W card in the Ryzen box was busy with unrelated work the whole time, which is exactly why I measured the other one.</p>

<table>
  <thead>
    <tr>
      <th>Load</th>
      <th style="text-align: right">GPU power</th>
      <th style="text-align: right">% of 575W limit</th>
      <th style="text-align: right">GPU temp</th>
    </tr>
  </thead>
  <tbody>
    <tr>
      <td>Idle (model resident)</td>
      <td style="text-align: right">9W</td>
      <td style="text-align: right">2%</td>
      <td style="text-align: right">32°C</td>
    </tr>
    <tr>
      <td>Decode, 1 stream</td>
      <td style="text-align: right">277W</td>
      <td style="text-align: right">48%</td>
      <td style="text-align: right">43°C</td>
    </tr>
    <tr>
      <td>Decode, 4 streams</td>
      <td style="text-align: right">315W</td>
      <td style="text-align: right">55%</td>
      <td style="text-align: right">47°C</td>
    </tr>
    <tr>
      <td>Unique 100k prefill</td>
      <td style="text-align: right"><strong>570W</strong></td>
      <td style="text-align: right"><strong>99%</strong></td>
      <td style="text-align: right">68°C</td>
    </tr>
  </tbody>
</table>

<p>That last row is the one to sit with. Prefill didn’t just approach the card’s rating — it sat about five watts under it, with samples peaking at 572W against a 575W wall. During a long prefill this card isn’t choosing how much power to draw — it’s being held back by the limiter. Decode never got past half.</p>

<p>That’s <strong>2.06× the power of decode</strong> on the same card running the same weights: a 293W spread, about a slow cooker on high, hiding behind two rows that both report 99% utilization. That utilization figure is close to useless here. It reports whether a kernel is resident, not whether the transistors are doing anything expensive.</p>

<p>The mechanism is the same one that made <a href="/qwen38-27b-three-boxes-prefill/">the three-boxes post</a> end up being about prefill. Decode emits one token at a time and spends its life waiting on memory — stream the weights, do a trivial amount of arithmetic, repeat. It’s bandwidth-bound, and a bandwidth-bound kernel leaves the tensor cores standing around drawing almost nothing. Prefill eats the entire prompt as one enormous matrix multiply. That’s FLOPS, that’s the tensor cores lit up, and that’s the only workload I’ve measured that makes a 575W card actually ask for 575W.</p>

<p>The corollary I hadn’t considered until I had both rows side by side: <strong>you cannot heat a house with chat.</strong> Every evening I’ve described as “firing up the space heaters” while asking a model who caught the Immaculate Reception, I was running the card at 48% of nameplate and calling it heating.</p>

<h2 id="sparse-models-make-bad-furnaces">Sparse models make bad furnaces</h2>

<p>The model on that card is a 35B mixture-of-experts with roughly 3B active parameters, and that detail turns out to matter more than I expected.</p>

<p>MoE decode is the least thermally productive thing a GPU can do. The router picks a couple of experts, so a given token touches only a small slice of the weights — less memory traffic than a dense model of the same nominal size, and still no meaningful math. That’s exactly why it decodes so fast at 254 tok/s, which is wonderful for chat and useless for heating. Sparse activation is a computational bargain, and heating is the one application where you don’t want a bargain.</p>

<p>Prefill doesn’t get that discount. Push 100,000 tokens through at once and the batch is large enough that essentially every expert gets work. The sparsity that saves you on decode buys you nothing on ingest.</p>

<p>Which sets up a rule I like:</p>

<blockquote>
  <p><strong>Dense models are better space heaters than sparse ones. Prefill is a better space heater than decode. And the two effects stack.</strong></p>
</blockquote>

<p>The dense 27B on the other box lands where that predicts: its decode sits meaningfully higher, because a dense model streams every weight for every token, while its prefill ends up in the same near-nameplate territory. That box was serving other traffic while I sampled it, so I’m treating those figures as directional and re-running them when it’s quiet. The ordering is solid; I don’t yet trust the third digit.</p>

<p>Batching is the other lever, and it’s a weak one. Four decode streams instead of one added just 38W. It should help, and it does — not enough to matter. You cannot batch your way to a warm house.</p>

<h2 id="watts-are-watts">Watts are watts</h2>

<p>A GPU is a resistive heater with a side effect. Essentially all the electrical energy going in comes out as heat in that room; the tokens are free. The conversion is arithmetic at 3.412 BTU/hr per watt.</p>

<p>Adding up the enforced limits, the two Blackwell boxes carry <strong>1,775W of GPU nameplate</strong> — a 600W 5090, the 575W external 5090, a 300W PRO 6000 Max-Q, and a 300W 5070 Ti. Add CPUs, drives, and power supply losses and the room’s ceiling lands right around the 2,400W I’ve been quoting since January, which is a nicer coincidence than I deserve:</p>

<table>
  <thead>
    <tr>
      <th>Load</th>
      <th style="text-align: right">Electrical</th>
      <th style="text-align: right">Heat output</th>
      <th style="text-align: right">Cost at $0.15/kWh</th>
    </tr>
  </thead>
  <tbody>
    <tr>
      <td>One 5090, decode</td>
      <td style="text-align: right">277W</td>
      <td style="text-align: right">~945 BTU/hr</td>
      <td style="text-align: right">$1.00/day</td>
    </tr>
    <tr>
      <td>One 5090, prefill</td>
      <td style="text-align: right">570W</td>
      <td style="text-align: right">~1,945 BTU/hr</td>
      <td style="text-align: right">$2.05/day</td>
    </tr>
    <tr>
      <td>Whole rack, working</td>
      <td style="text-align: right">~2,400W</td>
      <td style="text-align: right">~8,200 BTU/hr</td>
      <td style="text-align: right">$8.64/day</td>
    </tr>
    <tr>
      <td>Hardware store space heater</td>
      <td style="text-align: right">1,500W</td>
      <td style="text-align: right">~5,120 BTU/hr</td>
      <td style="text-align: right">$5.40/day</td>
    </tr>
  </tbody>
</table>

<p>The rack at full tilt is about a <strong>1.6× space heater</strong>, which retroactively justifies eight months of calling it one. That same rack on decode-only work is more like 0.8×.</p>

<p>I want to be careful about the efficiency claim, because it’s the part people get wrong in both directions — including me, on the first draft of this post.</p>

<p>A GPU is electric resistance heat, and at $0.15/kWh that’s about <strong>$44 per million BTU</strong>. Against the heat pumps this is a rout: they deliver the same BTU for roughly $15 when they’re behaving, and around $22 when it’s cold enough that the coefficient of performance falls off. No argument there.</p>

<p>Oil is where I was wrong. I’d been carrying $3.50 a gallon around in my head, which lands oil in the high $20s and makes the GPUs look like three times the cost of running the furnace. Oil is not $3.50 anymore. It’s been <strong>$4.30–$4.50</strong> a gallon in Virginia this year. A gallon of No. 2 holds 138,500 BTU, and a boiler at 86% AFUE delivers about 119,000 of them:</p>

<table>
  <thead>
    <tr>
      <th>Heat source</th>
      <th style="text-align: right">Cost per million BTU</th>
    </tr>
  </thead>
  <tbody>
    <tr>
      <td>Heat pump, COP 3</td>
      <td style="text-align: right">~$15</td>
    </tr>
    <tr>
      <td>Heat pump in the cold, COP 2</td>
      <td style="text-align: right">~$22</td>
    </tr>
    <tr>
      <td>Oil, $4.40/gal at 86% AFUE</td>
      <td style="text-align: right">~$37</td>
    </tr>
    <tr>
      <td><strong>GPUs (electric resistance)</strong></td>
      <td style="text-align: right"><strong>~$44</strong></td>
    </tr>
    <tr>
      <td>Oil at its March 2026 peak, $5.54/gal</td>
      <td style="text-align: right">~$47</td>
    </tr>
  </tbody>
</table>

<p>So the GPUs are about <strong>15–20% worse than the oil burner</strong>, not three times worse. And during the March spike, oil crossed $46 per million BTU and the space heaters were briefly the <em>cheaper</em> heat in the house, which is not a sentence I expected to write when I started this post. <strong>Strictly as a heater the GPUs still lose — but only to the heat pumps by much, and to oil by a margin thin enough to disappear on a bad week for crude.</strong></p>

<p>That comparison is a trap, though, and it’s the same trap as January. I’m not buying heat. I’m buying compute I was going to buy anyway, and the heat falls out for free — marginal cost zero, because the electricity was already committed to the thing I actually wanted. The only real decision is <em>when</em> to spend it, which is where a 293W gap turns into a plan.</p>

<h2 id="prefill-is-winter-work">Prefill is winter work</h2>

<p>If prefill converts twice as much electricity into heat as decode, then the workload mix isn’t only a throughput question. It’s a seasonal one.</p>

<p>And the most prefill-heavy thing in the building is the thing we’re actually trying to ship. <a href="https://teracontext.ai">TeraContext</a> takes a commercial RFP — a 500 to 2,000 page specification book plus the drawing set — classifies pages against a work breakdown structure, and bundles them into trade packages with a citation back to the paragraph it used. That means 100,000+ token windows, thousands of calls per job, and short outputs. As the three-boxes post worked out, roughly <strong>95% of one of those turns is prefill</strong>: the model spends its time reading Division 03 and almost no time talking.</p>

<p>So construction spec takeoff is, thermally, the best workload we have. It’s the one job that holds a card at the power limit for hours instead of dropping to 277W between tokens, and it produces something a client is paying for.</p>

<p>The scheduling rule for this winter, which is the actual conclusion here:</p>

<ul>
  <li><strong>Batch prefill-heavy work into the cold months and the cold hours.</strong> Spec takeoff, corpus ingest, embedding and reranking backfills, long-context evals. Anything where the prompt is the work. Queue it overnight in January and the family room is warm by morning.</li>
  <li><strong>Push decode-heavy work to summer.</strong> Chat, coding assistance, the debate platform, short-answer benchmarks. Same tokens either way, half the heat, in a room that’s already at 80°F.</li>
  <li><strong>Prefer the dense model in winter and the sparse one in summer</strong>, when quality permits. I did not expect the model zoo to acquire a seasonal dimension.</li>
  <li><strong>Long-context sweeps are a December luxury.</strong> A 176k-token window is the hottest thing I can run. That’s not an August experiment.</li>
</ul>

<p>None of this changes a benchmark number. It just means the calendar gets a say in queue order, which it never had before.</p>

<h2 id="thirty-minutes-from-the-data-center-capital-of-the-world">Thirty minutes from the data center capital of the world</h2>

<p>Which raises the obvious question. I live near Ashburn, Virginia. There is more data center capacity within a half-hour drive of my house than in most countries. Why is any of this in my basement?</p>

<p>Because of how colocation is priced, and because my deployment is precisely the shape colo prices badly.</p>

<p>Start with power. GPU rack rental varies, but all in you’re looking at roughly <strong>$300 per kW per month billed on peak demand</strong>. My rack peaks at 2.4 kW, so that’s <strong>$720 a month</strong> whether I use it or not.</p>

<p>Except $720 is the floor, not the bill. Providers charge on space <em>or</em> power, whichever is greater, and 2.4 kW simply isn’t much power. My gear needs about 22U — and consumer tower cases don’t rack, so each one eats four or five U sitting on a shelf. Spread 2.4 kW across 22U and the density is <strong>109 watts per U</strong>, in a market where cabinets are routinely provisioned at 5 to 10 kW and up. I’d be renting rack space I have no way to fill with power, which means the <em>space</em> charge binds, not the power charge. Half-cabinet space in Ashburn runs about <strong>$861 to $1,100 a month</strong> right now, and a full 48U cabinet is $1,500 to $1,875. Cross-connects, bandwidth, and remote hands stack on top.</p>

<p>So the honest colo number for my footprint is <strong>$900 to $1,100 a month</strong>, not $720. Low density is the trap: below roughly 3 kW a cabinet you stop buying electricity and start buying floor.</p>

<p>Meanwhile my workload isn’t steady. It’s bursty and irregular, maybe <strong>15% duty cycle</strong> across a month — a weekend of benchmarks, a takeoff run, then days where the cards idle at 9W. Metered at $0.15/kWh that’s about <strong>$50 a month</strong>. Colo prices power like a subscription on the peak; the utility prices it like a meter on the consumption.</p>

<table>
  <thead>
    <tr>
      <th> </th>
      <th style="text-align: right">Monthly</th>
      <th>Basis</th>
    </tr>
  </thead>
  <tbody>
    <tr>
      <td>Colocation, ~22U at 2.4 kW</td>
      <td style="text-align: right"><strong>$900–$1,100</strong></td>
      <td>greater of space or power</td>
    </tr>
    <tr>
      <td>— if billed on power alone</td>
      <td style="text-align: right">$720</td>
      <td>2.4 kW × $300/kW</td>
    </tr>
    <tr>
      <td>My basement, ~15% duty</td>
      <td style="text-align: right"><strong>~$50</strong></td>
      <td>metered consumption</td>
    </tr>
  </tbody>
</table>

<p>That’s roughly <strong>$11,000 a year</strong>, which is a couple of GPUs. And none of it includes the reset button: when something wedges I either pay a tech for remote hands or drive thirty minutes each way. Downstairs is thirty seconds. The rest of what colo sells, I already have — redundant internet, redundant power with UPS, and Cloudflare in front as the CDN.</p>

<p>Then there’s the part this whole post is about. Four months of the year the waste heat is worth something. No colocation contract will ever credit me for that. In Ashburn I’d be paying a premium to have someone else’s chillers throw away the exact BTUs I want in my family room in January.</p>

<p><strong>None of which survives scale, and the reason isn’t money.</strong> Run it flat out at 100% duty cycle and the basement is <em>still</em> cheaper — about $259 a month against $900-plus. Home electricity wins on the meter at every duty cycle I can model. Colo doesn’t beat my basement on price and it never will.</p>

<p>What beats my basement is the ability to get rid of heat, and that’s the wall I’m actually up against. <strong>The room is out of thermal headroom.</strong> Put the current rack in cooling terms: 2.4 kW is 8,200 BTU/hr, which is <strong>0.68 tons</strong> of heat rejection. The dedicated cooling capacity currently serving that room is zero tons. That gap is the entire reason it sat at 85°F all summer, and it’s why the honest answer to “can you add another card” is no.</p>

<p>And to be clear about which constraint is actually binding, it isn’t the panel. That 2.4 kW is 20 amps spread across three 15-amp circuits. Derated to the 80% you’re allowed to hold continuously, those three circuits carry 4,320W, so I’m running at about <strong>56% of my electrical capacity</strong> with roughly 1,900W of headroom — call it another big card and its host. I could plug more hardware in tomorrow and the breakers would be perfectly happy. The room would cook. <strong>The wiring has room and the air does not</strong>, and that’s the whole problem in one sentence.</p>

<p>The arithmetic past that is unforgiving. A 5 kW rack wants about <strong>1.4 tons</strong> of dedicated cooling; 10 kW wants nearly <strong>3 tons</strong> — a real mechanical system, ducted and drained and condensate-pumped. At that point the panel does become an issue too, since 10 kW is 83 amps and a subpanel. That is not a shopping trip. It’s a major construction project on a house that was never meant to be a data hall, and I’d pay for it twice: once to build it, then again every July to run it.</p>

<p>And once the answer to “how do we get more compute” is “renovate the house,” the answer is really <strong>lease commercial space.</strong> Not a colocation rack — paying for floor space I can’t fill with power is still terrible value for a bursty load, and I already own the redundant power, redundant internet, and CDN that colo is mostly selling. Commercial space is different: I’d be buying square footage with cooling engineered for the load and power still on a meter, and a loading dock instead of a basement stairwell. On which point — try getting a full 42U cabinet, call it seven feet on casters, down a straight run of basement stairs. There’s no corner to snag on. It’s just that tilting seven feet of steel back onto a staircase runs the top of it into the ceiling, and once it’s leaning it very much wants to get to the bottom faster than you do. The workaround is building the rack in place from parts, which is its own kind of penance. That’s a different blog post.</p>

<p>So the honest version: the basement wins right now precisely <em>because</em> the load is irregular and the heat has somewhere useful to go. Both of those stop being true the moment this is production. The thing that makes it a good furnace is the same thing that caps its size — and the space heater era has an expiration date measured in tons of cooling, not dollars per month.</p>

<h2 id="what-has-to-happen-before-november">What has to happen before November</h2>

<p><strong>1. Put a sensor in the basement.</strong> This is the whole problem. I already run <code class="language-plaintext highlighter-rouge">dcgm-exporter</code>, Prometheus, and Grafana. I checked what’s actually in there: GPU die temperature, GPU memory temperature, motherboard hwmon, thermal zones. <strong>There is no metric for the room.</strong> I can tell you a 5090 hit 68°C during a 100k-token prefill at two-second resolution, and the best I have for the space that card is heating is “80, I think.”</p>

<p><strong>2. Get the heat where the vote is.</strong> A real zone for the basement, or a transfer path — a return near the rack, a boosted duct into the first-floor return. In winter I want that air upstairs and in summer I want it gone, which is the same duct with opposite intent. The external 5090 is the interesting case: a standalone enclosure putting 570W into one concentrated spot rather than burying it in a chassis, which makes it the easiest heat source in the room to duct on purpose.</p>

<p><strong>3. Wire the furnace interlock.</strong> In January my wife asked me to set up the oil furnace to come on when the heat pumps can’t keep up. I said I’d look into it tomorrow. That was seven months ago. Once the room is instrumented, the interesting version becomes possible: let GPU heat count as the first stage. Heat pumps, then GPUs, then oil.</p>

<p><strong>4. Set a summer ceiling.</strong> 85°F is fine for silicon and less fine for the drives, the power supplies, and the UPS batteries. Past a threshold, the long-context sweeps wait for October.</p>

<h2 id="so">So</h2>

<p>The joke for eight months has been that these are space heaters that happen to do inference. The measurement says something sharper: they’re space heaters with a high setting and a low setting, the high setting is the one that reads thousand-page specification books, and I have been running the low setting on purpose every time I sat down to chat with them.</p>

<p>At dinner I told my wife the basement had been hitting 85 degrees this summer.</p>

<p>“I know,” she said. “That’s why I stopped putting the laundry down there in July.”</p>

<p>She had known since roughly the first week of June, and had not mentioned it, on the theory that I would eventually measure something and find out on my own. Which is exactly what happened.</p>

<p>“Good news is it should be great in January.”</p>

<p>“Did you ever set up the furnace?”</p>

<p>“…I’ll look into it tomorrow.”</p>

<hr />

<p><em>Power and thermal figures sampled August 17, 2026 on the externally-enclosed RTX 5090 — 575W enforced limit, default and maximum both — running Qwen3.6-35B-A3B-NVFP4 under vLLM at 262k context, FP8 KV cache, vision enabled, with the other two GPUs on that host at 0%. <code class="language-plaintext highlighter-rouge">nvidia-smi</code> polled at 2-second intervals; the first quarter of each load window is discarded as ramp-up. Decode is streamed with <code class="language-plaintext highlighter-rouge">ignore_eos</code>; prefill uses fresh random-word prompts at ~98k tokens to defeat the prefix cache. Dense-model comparisons are directional only — that box was serving other traffic at 99% utilization while I sampled it, and will be re-run when it’s quiet. Heat conversion at 3.412 BTU/hr per watt; electricity at $0.15/kWh. Basement temperature is a handheld reading, which is the entire point of item 1.</em></p>]]></content><author><name>Jim Smith</name></author><category term="AI Technology" /><category term="gpu" /><category term="rtx-5090" /><category term="prefill" /><category term="thermal" /><category term="power" /><category term="moe" /><category term="teracontext" /><category term="local-llm" /><category term="home-lab" /><category term="vllm" /><category term="colocation" /><summary type="html"><![CDATA[Prefill pulls 570W and decode 277W on the same RTX 5090, which makes construction spec takeoff the best winter heating workload in an 85°F basement.]]></summary></entry><entry><title type="html">Qwen3.8-27B on Three Boxes: 2.5× Decode, 36× Prefill</title><link href="https://joshua8.ai/qwen38-27b-three-boxes-prefill/" rel="alternate" type="text/html" title="Qwen3.8-27B on Three Boxes: 2.5× Decode, 36× Prefill" /><published>2026-08-15T00:00:00+00:00</published><updated>2026-08-15T00:00:00+00:00</updated><id>https://joshua8.ai/qwen38-27b-three-boxes-prefill</id><content type="html" xml:base="https://joshua8.ai/qwen38-27b-three-boxes-prefill/"><![CDATA[<p><img src="/images/qwen38-three-boxes.jpg" alt="Cartoon: an estimator with the Friday bid deadline circled on the calendar, buried in 2,000-page project manuals, while the $1,000 eBay server's prefill progress bar reads &quot;estimated completion: 4 days, 12 hours&quot; at 10%" /></p>

<p><em>Follows the $1,000 eBay series — <a href="/200b-parameters-1000-ebay-hardware/">200 Billion Parameters for $1,000</a>, <a href="/1000-box-one-month-mtp-model-zoo/">The $1,000 Box, One Month On</a>, <a href="/junk-drawer-upgrade-64gb-ddr4-quantization/">The Junk Drawer Upgrade</a> — and the <a href="/two-5070ti-part1-pipeline-vs-tensor-parallel/">two 5070 Ti</a> writeup.</em></p>

<h2 id="tldr">TL;DR</h2>

<p>Qwen3.8-27B was getting all the hype this weekend — same as Meta’s Glimmer last weekend, and DeepSeek-V4-Flash the weekend before that — so I ran it on the three lab boxes. Those are the Xeon 2x P5000 (Pascal) — the ~$1,000 eBay special — Ultra9 with two RTX 5070 Tis, and the Ryzen box with one RTX 5090. Thirty-two gigs of VRAM on each, just arranged differently: two 180 W 16 GB Pascal GPUs, two 300W 16 GB Consumer Blackwell GPUs, and one 600W 32 GB Blackwell GPU.</p>

<p>If you only look at generation, the upgrade is boring. Pascal does 23.4 tok/s, the 5070 Tis do 51.8, the 5090 does 57.3. Call it 2×, maybe 2.5×. All three are faster than most people read. For “Who caught the Immaculate Reception?” I’d still tell someone to buy the eBay box. That’s the equivalent of walking over to the trailer to pull one page from the drawing set.</p>

<p>Prefill is what actually changed. Unique ~16k-token prompts (so the prefix cache couldn’t cheat) went at 257 tok/s on the Xeon 2x P5000, 2,185 on the 5070 Tis, and 9,204 on the 5090 — about 36 times the Pascal pair.</p>

<p>That’s the number <a href="https://teracontext.ai">TeraContext</a> cares about. Construction specs are 500 to 2,000 pages, the model sees 100k+ tokens at a time, and a real job is thousands of those calls — takeoff on the whole project manual, not one detail. At 257 tok/s, one 100k window is six and a half minutes and a thousand of them is four and a half days. The 5090 does the thousand in about three hours. I like the cheap box. We just don’t have four days.</p>

<hr />

<h2 id="the-three-boxes-one-model">The three boxes, one model</h2>

<p>The last few posts were about getting 200B-class MoEs running at all. <code class="language-plaintext highlighter-rouge">--cpu-moe</code>, pinning 108 GB of experts in RAM, the junk-drawer DDR4 — that was “can I run this.” This one is just: the internet spent the weekend on Qwen3.8, so I put the same weights on the three boxes and timed them.</p>

<ul>
  <li><strong>Xeon 2x P5000 (Pascal).</strong> Dual E5-2698 v4, two $250 Quadro P5000s from 2016 (16 GB each, 32 GB together), the ~$1,000 build. It’s stuck on a CUDA 12.8 <code class="language-plaintext highlighter-rouge">llama.cpp</code> image because CUDA 13 dropped Pascal, which means it will never run the vLLM we use on the Blackwell boxes. The weights here are an INT4 GGUF — only Blackwell has native NVFP4, so Pascal doesn’t get the Unsloth NVFP4 file the other two boxes are running. MTP is on. That’s why a 27B here is at 23 tok/s instead of the ~12 we saw in July before MTP.</li>
  <li><strong>Ultra9, two RTX 5070 Tis.</strong> The consumer desktop from the <a href="/two-5070ti-part1-pipeline-vs-tensor-parallel/">boardwalk posts</a>. 16 GB per card, 32 GB together, no NVLink, vLLM tensor-parallel, same Unsloth NVFP4 weights. MTP is off.</li>
  <li><strong>Ryzen, one RTX 5090.</strong> The ~$5,000 box from the first post. One 32 GB card, vLLM 0.27.1, 180k context, vision left on because that’s how we actually serve it. MTP is off here too.</li>
</ul>

<p>The RTX boxes aren’t leaving MTP on the table for fun. Vision, MTP, and a long context window don’t all fit in 32 GB. We kept vision and the long window, so MTP had to go. The Xeon isn’t doing vision, so it can spend that VRAM on MTP. Fair to know when you look at the 23 vs 52 vs 57 decode numbers: the cheap box is the only one drafting.</p>

<p>One request at a time, thinking off. Decode is 400 tokens streamed with <code class="language-plaintext highlighter-rouge">ignore_eos</code>, timed from the first output token. Prefill used a fresh random-word prompt each time, because the first C=1 run this week looked amazing until I realized I was measuring prefix cache. Cached prefill comes back in the 8k–22k tok/s range and tells you nothing about a new document.</p>

<table>
  <thead>
    <tr>
      <th>Card set</th>
      <th style="text-align: right">Decode (tok/s)</th>
      <th style="text-align: right">Unique prefill ~16k (tok/s)</th>
    </tr>
  </thead>
  <tbody>
    <tr>
      <td>Xeon 2x P5000 (Pascal)</td>
      <td style="text-align: right">23.4</td>
      <td style="text-align: right">257</td>
    </tr>
    <tr>
      <td>Ultra9 2× RTX 5070 Ti</td>
      <td style="text-align: right">51.8</td>
      <td style="text-align: right">2,185</td>
    </tr>
    <tr>
      <td>Ryzen RTX 5090</td>
      <td style="text-align: right">57.3</td>
      <td style="text-align: right">9,204</td>
    </tr>
  </tbody>
</table>

<p>Decode is 2.2× and 2.5×. Prefill is 8.5× and 36×. Generation is mostly memory bandwidth; prefill is FLOPS and tensor cores, and a 2016 P5000 has basically none of the latter. Seeing it on one model just makes the gap harder to talk around.</p>

<h2 id="who-caught-the-immaculate-reception">“Who caught the Immaculate Reception?”</h2>

<p>A normal chat turn is almost all decode. Twenty tokens of question, maybe 150 tokens of answer.</p>

<p>On the Xeon 2x P5000 the prompt is gone in a tenth of a second. The answer is 150 ÷ 23.4, about <strong>6.4 seconds</strong>. Same answer on the 5090 is 150 ÷ 57.3, about <strong>2.6 seconds</strong>. You can tell them apart if you’re watching the cursor. If you’re just trying to get an answer, both are faster than I read.</p>

<p>That’s the walk to the trailer. You need one detail out of the project manual, you grab the binder, you flip to it, you go back to work. It is not even worth booting the computer for that one page. For a coding assistant, or to ask who caught the Immaculate Reception, the original claim still holds: the $1,000 eBay special is a lot of model for the money. Spending five times as much to talk 2.5× faster is a luxury, not a requirement.</p>

<h2 id="a-thousand-page-spec-is-a-different-job">A thousand-page spec is a different job</h2>

<p><a href="https://teracontext.ai">TeraContext</a> is the thing we actually have to ship. A commercial RFP shows up as a 500–2,000 page specification book and a drawing set. The software classifies pages against a work breakdown structure, bundles them into trade packages, and has to point at the paragraph it used. That is not a trip to the trailer for one detail. That is takeoff on the whole project manual — usually <strong>100,000+ tokens</strong> a call, <strong>thousands of times</strong> on one job — because a spec is a few thousand sections plus addenda plus the “does this also apply to the electrical package” checks.</p>

<p>Almost all of the wait is prefill. The classification that comes out the other side is short. Using the unique-prefill rates above, one 100,000-token call:</p>

<blockquote>
  <p><strong>Xeon 2x P5000:</strong> 100,000 ÷ 257 = 389 seconds = <strong>6 minutes 29 seconds</strong>
<strong>2× RTX 5070 Ti:</strong> 100,000 ÷ 2,185 = <strong>46 seconds</strong>
<strong>RTX 5090:</strong> 100,000 ÷ 9,204 = <strong>11 seconds</strong></p>
</blockquote>

<p>The generated tokens on that call barely show up. A hundred tokens of “cast-in-place concrete, WBS 3.2” is four seconds on Pascal and under two on the 5090. Something like 95% of the turn is just eating the window.</p>

<p>A thousand calls is a light day on a real set. Some jobs are more.</p>

<table>
  <thead>
    <tr>
      <th> </th>
      <th style="text-align: right">One 100k call</th>
      <th style="text-align: right">1,000 calls</th>
      <th style="text-align: right">2,000 calls</th>
    </tr>
  </thead>
  <tbody>
    <tr>
      <td>Xeon 2x P5000 (Pascal)</td>
      <td style="text-align: right">6m 29s</td>
      <td style="text-align: right"><strong>4 days 12 hours</strong></td>
      <td style="text-align: right"><strong>9 days</strong></td>
    </tr>
    <tr>
      <td>Ultra9 2× RTX 5070 Ti</td>
      <td style="text-align: right">46s</td>
      <td style="text-align: right">12.7 hours</td>
      <td style="text-align: right">25 hours</td>
    </tr>
    <tr>
      <td>Ryzen RTX 5090</td>
      <td style="text-align: right">11s</td>
      <td style="text-align: right"><strong>3.0 hours</strong></td>
      <td style="text-align: right"><strong>6.1 hours</strong></td>
    </tr>
  </tbody>
</table>

<p>I sat with that 4-day number for a minute because it sounds like I dropped a zero. 389 seconds times 1,000 is 108 hours. That’s four and a half days of the dual-Xeon box doing nothing but ingest. The 5090 is done in three hours. The 5070 Tis take a long workday, or two if you run 2,000 calls.</p>

<p>You can move one load of spoils with a wheelbarrow. You cannot clean a basement excavation that way and still make the pour. Estimators do not have from Friday’s addendum until the following Tuesday for the GPUs to finish reading.</p>

<p>Two things make this slightly less ugly, and not enough of either. The 100k times assume the 16k rate holds. It doesn’t — longer prompts get slower. At 180k we measured 1,415 tok/s on the 5070 Tis and 3,268 on the 5090. I didn’t run 180k unique on Pascal this time; at the 32k rate of 226 tok/s that window is already thirteen minutes. Prefix cache helps when the next call starts the same way, but TeraContext’s windows walk through the book. They overlap some. Not enough. You still pay for most of the page.</p>

<h2 id="what-i-think-the-extra-money-is-for">What I think the extra money is for</h2>

<p>People ask if the 5090 is “worth it” next to the eBay box. For this model I think that’s the wrong framing. You’re not buying a faster walk to the trailer. You’re buying the difference between flipping one page and taking off the book.</p>

<p>The $1,000 machine is still the right buy if you want to talk to a 27B, or keep running the 200B MoEs that don’t fit anywhere else. MTP already doubled decode on the 27B in July, and that’s only on this box — the RTX machines can’t stack it on top of vision and 180k. I would not spend $4,000 to shave four seconds off “who caught the Immaculate Reception.” The wheelbarrow is the right tool for one load.</p>

<p>The ~$5,000 Ryzen box is what you buy if the prompt is the work. Same 27B, only a little quicker on the way out, 36× quicker on the way in. The 5090 isn’t even that far ahead of the two 5070 Tis on decode (57 vs 52 tok/s), but it’s about 4× on a 16k unique prefill and still 2.3× at 180k. For long documents I’d take the one 32 GB card over the pair of 16 GB cards, and either over the P5000s. There isn’t a llama.cpp flag that closes a 36× compute gap.</p>

<p>If you already have the 5070 Ti desktop and your prompts are tens of thousands of tokens, use it. I wouldn’t buy it for chat, and I wouldn’t make it the only box for a 180k construction window if the 5090 is sitting there.</p>

<p>This doesn’t undo the first post. The Xeon 2x P5000 is still why I can run DeepSeek-V4-Flash at all. That’s a different weekend’s hype and a different reason to own the box. This weekend the question was just Qwen3.8 on the hardware we already have. When they all run the same weights, prefill is the number I actually care about.</p>

<h2 id="so">So</h2>

<p>If you want a local chatbot, get the eBay special. Walk to the trailer, pull the page, go back to work. It will tell you Franco Harris caught the Immaculate Reception in Three Rivers Stadium in 1972 and you can feel clever about the receipt.</p>

<p>If you want takeoff on Division 03 a thousand times before Friday’s bid, it will still be on page 400 on Tuesday. The 5090 is done Monday afternoon. We don’t have until Tuesday.</p>]]></content><author><name>Jim Smith</name></author><category term="AI Technology" /><category term="qwen" /><category term="qwen3.8" /><category term="vllm" /><category term="llama-cpp" /><category term="pascal" /><category term="p5000" /><category term="5070ti" /><category term="rtx-5090" /><category term="prefill" /><category term="teracontext" /><category term="local-llm" /><category term="budget" /><summary type="html"><![CDATA[Qwen3.8-27B on the $1,000 Xeon 2x P5000, two 5070 Tis, and a 5090. Decode is 2–2.5×. Unique prefill is up to 36×, which is what TeraContext actually waits on.]]></summary></entry><entry><title type="html">The Junk Drawer Upgrade: What 64 GB of Forgotten DDR4 Taught Me About Quantization</title><link href="https://joshua8.ai/junk-drawer-upgrade-64gb-ddr4-quantization/" rel="alternate" type="text/html" title="The Junk Drawer Upgrade: What 64 GB of Forgotten DDR4 Taught Me About Quantization" /><published>2026-07-31T00:00:00+00:00</published><updated>2026-07-31T00:00:00+00:00</updated><id>https://joshua8.ai/junk-drawer-upgrade-64gb-ddr4-quantization</id><content type="html" xml:base="https://joshua8.ai/junk-drawer-upgrade-64gb-ddr4-quantization/"><![CDATA[<p><img src="/images/junk-drawer-64gb-ddr4.png" alt="A junk drawer of forgotten DDR4 memory sticks — 64 GB added to a $1,000 eBay Xeon box" /></p>

<p><em>A follow-on to <a href="/1000-box-one-month-mtp-model-zoo/">The $1,000 Box, One Month On: A Model Zoo and Multi-Token Prediction</a>, which followed <a href="/200b-parameters-1000-ebay-hardware/">200 Billion Parameters for $1,000: Running 4-Bit Quants on eBay Hardware</a>.</em></p>

<p><em>Follow-up: <a href="/qwen38-27b-three-boxes-prefill/">Qwen3.8-27B on Three Boxes: 2.5× Decode, 36× Prefill</a> — same 27B on the Xeon 2x P5000, two 5070 Tis, and a 5090. Decode is 2–2.5×. Unique prefill is 36×.</em></p>

<h2 id="tldr">TL;DR</h2>

<p>Cleaning out the junk drawer, I found 64 GB of DDR4 I’d paid $50 for before the rampacolypse. The sensible move was listing it on Facebook Marketplace for some astronomical number like $600. Instead I plugged it into the eBay Xeon box from the last two posts, taking it from 128 GB to 192 GB — the first hardware change in the entire series.</p>

<p>Then I handed the box to Claude Opus and told it to go find the wins: pick the quants, run the benchmarks, keep the ones that pay. I stayed out of the way except for a handful of calls where I overrode it. That division of labor turns out to matter to the story, because <strong>four of the five quant upgrades made models <em>slower</em>, one by 23%, and the only outright win was an upgrade Opus recommended skipping and I ran anyway.</strong> Along the way a piece of folklore in my own notes — that i-quants dequantize slower than K-quants on CPU — failed head-on twice and had to be thrown out.</p>

<p>The useful result is two rules that actually predict what a quant change costs on a CPU-offloaded box, and they are not the same rule:</p>

<ul>
  <li><strong>Prefill tracks bytes added.</strong> +1.1 GB is free. +25 to +48 GB costs 15–20%.</li>
  <li><strong>Decode tracks expert bits-per-weight</strong>, not quant format. Fewer bits per weight, less RAM traffic per token, faster decode — whatever the letters in the filename say.</li>
</ul>

<p>Higher quant ≠ better. On this box it’s usually <em>quality bought with speed</em>, and you should know the exchange rate before you spend 40 GB of download on it.</p>

<p>And the other thing more memory appears to buy — huge context windows — turns out to be mostly theoretical at these prefill rates. Filling DeepSeek’s context to 128K means <strong>35 minutes before the first token appears.</strong> Point a coding agent at it with a 64K context and a 20-turn loop takes <strong>6h 14m</strong>, against under two minutes for a smaller model on a consumer Blackwell card. I raised zero context windows this round, and the section near the end does that arithmetic in full.</p>

<hr />

<h2 id="the-junk-drawer">The junk drawer</h2>

<p>The box in this series has never had a hardware change. That was sort of the point — two posts about squeezing 200B-class models out of $1,000 of 2016-vintage eBay parts, and all the gains came from software: <code class="language-plaintext highlighter-rouge">--cpu-moe</code>, layer offload tuning, split modes, and multi-token prediction. Same dual E5-2698 v4s, same pair of $250 Quadro P5000s, same 128 GB of DDR4.</p>

<p>Then I found four 16 GB sticks in a drawer. Fifty dollars, bought well before DRAM prices went vertical. Current Marketplace comps for the same kit are genuinely absurd — I could have flipped it for something in the neighborhood of $600 and felt clever.</p>

<p>I put it in the server instead.</p>

<p>192 GB total, 188 usable. In practice that lifted the ceiling on how much model I can pin in RAM from about 105 GB to about 165 GB, because these models are <code class="language-plaintext highlighter-rouge">mlock</code>‘d — pinned into anonymous memory so the kernel can’t page an expert out to swap mid-generation. That pin is the whole trick from the first post, and its size <em>is</em> the constraint on how good a quant you can run.</p>

<p>So: new headroom, five models sitting at compromise quants chosen when the ceiling was 105 GB. Obvious move, right? Upgrade them all.</p>

<h2 id="how-this-actually-got-run">How this actually got run</h2>

<p>Worth being explicit about the working arrangement, because it shaped the result.</p>

<p>I didn’t do this optimization pass by hand. I gave Claude Opus the box — the repo, the router, shell access, the benchmark scripts — and a standing instruction: figure out which models can move to better quants now that there’s headroom, measure everything, keep what pays and revert what doesn’t. It picked the tiers, probed the files, ran the A/Bs, and wrote the results into the repo’s notes as it went.</p>

<p>My interventions were few and mostly consisted of pushing for <em>more</em> than it wanted to do:</p>

<ul>
  <li>It proposed a middle tier for DeepSeek; I asked why we weren’t going straight to the top 4-bit tier. (That one blew up spectacularly. Read on.)</li>
  <li>I extended the same top-tier question to two more models.</li>
  <li>It wanted to delete a rejected 144 GB quant; I told it to archive it to a spare array instead.</li>
  <li>It recommended skipping the Nemotron upgrade as pointless. <strong>I told it to run the benchmark anyway.</strong></li>
  <li>On hy3, it laid out a speed-versus-quality trade and asked which I wanted. I took the quality side, eyes open, and told it to skip the second perplexity run to save half an hour.</li>
</ul>

<p>That last category is the one I’d point at for anyone doing this. The model was rigorous about <em>measuring</em> — arguably more rigorous than I would have been, since it caught its own bad reasoning twice — but it was consistently conservative about <em>what was worth measuring</em>. The single biggest throughput gain of the exercise came from overruling a well-argued “don’t bother.”</p>

<h2 id="the-obvious-move-was-wrong-four-times-out-of-five">The obvious move was wrong four times out of five</h2>

<p>Here’s what actually happened. Every one of these is a same-build A/B — old quant and new quant measured back to back on the same binary, on a settled box, with the old files kept on disk until the comparison was done.</p>

<table>
  <thead>
    <tr>
      <th>Model</th>
      <th>Swap</th>
      <th>Δ size</th>
      <th>Decode</th>
      <th>Prefill</th>
      <th>Verdict</th>
    </tr>
  </thead>
  <tbody>
    <tr>
      <td>Nemotron-3-Super-120B</td>
      <td>Q4_K_M → Q4_K_XL</td>
      <td>+1.1 GB</td>
      <td><strong>+7.8%</strong></td>
      <td>−1.4%</td>
      <td><strong>Kept — the one win</strong></td>
    </tr>
    <tr>
      <td>MiniMax-M2.7-230B</td>
      <td>IQ4_XS → Q4_K_XL</td>
      <td>+30 GB</td>
      <td>−1.2%</td>
      <td>−16%</td>
      <td>Kept for quality</td>
    </tr>
    <tr>
      <td>Step3.7-Flash-198B</td>
      <td>IQ4_XS → Q4_K_XL</td>
      <td>+25 GB</td>
      <td>−6.1%</td>
      <td>−14.4%</td>
      <td>Kept for quality</td>
    </tr>
    <tr>
      <td>DeepSeek-V4-Flash-284B</td>
      <td>IQ3_XXS → Q4_K_XL</td>
      <td>+48 GB</td>
      <td><strong>−23%</strong></td>
      <td>−17%</td>
      <td><strong>Reverted</strong></td>
    </tr>
    <tr>
      <td>Hunyuan Hy3-295B</td>
      <td>Q2_K → IQ3_XXS</td>
      <td>+8 GB</td>
      <td>−28%</td>
      <td>−3.7%</td>
      <td>Rejected</td>
    </tr>
    <tr>
      <td>Hunyuan Hy3-295B</td>
      <td>Q2_K → Q3_K_M</td>
      <td>+32 GB</td>
      <td>−29%</td>
      <td>−20%</td>
      <td>Kept — deliberate quality call</td>
    </tr>
  </tbody>
</table>

<p>Four of six swaps made the model slower. One made it dramatically slower. The single upgrade that improved throughput was the one Opus had recommended skipping on the grounds that it barely changed anything.</p>

<p>Let me take the interesting failures in order, because each one broke a different assumption.</p>

<h2 id="failure-1-the-mxfp4-trap-23">Failure 1: the MXFP4 trap (−23%)</h2>

<p>DeepSeek-V4-Flash was running at UD-IQ3_XXS — a 3-bit quant — purely because the 4-bit version wouldn’t fit in the old 128 GB pin ceiling. This was the upgrade the RAM was <em>for</em>.</p>

<p>Opus initially queued a middle tier. I asked why we weren’t just going to UD-Q4_K_XL, the top 4-bit tier, since 144 GB now fit comfortably. No good reason surfaced, so we killed the first download and pulled the big one.</p>

<p>Decode fell from 6.94 to 5.33 tok/s. <strong>Minus 23%.</strong> Prefill fell 17%. The memory pin verified clean, swap was idle, the box wasn’t contended. It was just slower.</p>

<p>The reason is a genuinely counterintuitive property of this particular model, and it’s worth internalizing because more models are shipping this way. DeepSeek-V4-Flash is <strong>natively MXFP4</strong> — a 4-bit floating-point format the model was quantization-aware-trained in. So the tiers don’t work the way you assume. A <em>higher</em> tier doesn’t replace MXFP4 with something better; it <strong>preserves more of it</strong>:</p>

<table>
  <thead>
    <tr>
      <th>Tier</th>
      <th>MXFP4 share of expert tensors</th>
    </tr>
  </thead>
  <tbody>
    <tr>
      <td>UD-Q4_K_XL</td>
      <td><strong>100%</strong></td>
    </tr>
    <tr>
      <td>UD-IQ4_XS / Q3_K_M</td>
      <td>~35%</td>
    </tr>
    <tr>
      <td><strong>UD-IQ3_XXS</strong></td>
      <td><strong>0%</strong></td>
    </tr>
  </tbody>
</table>

<p>Pascal has no FP4 tensor cores. Every MXFP4 expert matmul on this box is a software dequantization loop. So the “best” quant of this model is the one that hands my nine-year-old GPUs the largest possible pile of arithmetic they have no silicon for. The shipped 3-bit quant is the only tier in the entire lineup with zero MXFP4 in it — which makes it not a compromise but very possibly the optimal choice for this hardware, and I’d been treating it as a placeholder for a year.</p>

<p>On a Blackwell card the ranking inverts completely. Same file, same flag, opposite answer.</p>

<p>Opus wanted to delete the 144 GB after the revert. I told it to archive the files to a spare array instead — if a future llama.cpp build lands a fast Pascal MXFP4 path, the test is a <code class="language-plaintext highlighter-rouge">cp</code> away rather than another overnight download.</p>

<p><strong>The cheap lesson, and it was cheap for a reason:</strong> the load log printed <code class="language-plaintext highlighter-rouge">ftype: MXFP4 MoE</code> while the model was coming up. Opus read that line and quoted it back to me as confirmation the right file had loaded — correct, and completely missing what it implied about throughput on a GPU with no FP4 units. The information that would have cancelled the download arrived <em>before the download finished</em>, and we both walked past it.</p>

<h2 id="failure-2-folklore-that-survived-because-nobody-tested-it">Failure 2: folklore that survived because nobody tested it</h2>

<p>Both MiniMax and Step3.7 were on IQ4_XS. Having seen the DeepSeek result, I asked whether the same top tier made sense for these two. Opus said yes — and expected a speed win on top of the quality win, citing a rule sitting in my own repo notes: <em>i-quants dequantize slower than K-quants on CPU.</em> These were textbook i-quant → K-quant swaps. Should be free speed.</p>

<p>MiniMax: decode flat (−1.2%), prefill −16%.
Step3.7: decode −6.1%, prefill −14.4%.</p>

<p>Tested head-on, twice, the rule lost twice. And when Opus went back to find where it came from, it turned out to rest on two incidental observations from unrelated work — never once a controlled comparison. It had been sitting in my notes for months looking like knowledge because nothing had contradicted it, mostly because nothing had asked it a direct question. I’d written it; the model inherited it and dutifully repeated it right up until the bench said no.</p>

<p>Both models stayed on the new quant anyway — I told it to keep them and delete the old files. That’s a deliberate trade: buying output quality with prefill throughput, with the price now known. The point isn’t that the upgrade was wrong, it’s that we’d have made the same call for the wrong reason and filed a fictitious speed win next to it.</p>

<h2 id="failure-3-a-rule-invented-written-into-the-docs-and-retracted-inside-a-day">Failure 3: a rule invented, written into the docs, and retracted inside a day</h2>

<p>Hy3 is the 295B monster, and the slowest thing in the rack — 21B active parameters per token means the heaviest expert matmul here by a wide margin. It was running Q2_K, a 2-bit quant, and my question was reasonable enough: with 64 GB more RAM, can we do better than 2-bit?</p>

<p>I also asked Opus to measure perplexity on the current quant first, so any quality claim about the replacement had a real baseline instead of vibes.</p>

<p><strong>Step one, Q2_K → IQ3_XXS (+8 GB): decode fell 28%.</strong> An 8 GB increase should be nearly free by the prefill rule — and prefill was indeed nearly free, −3.7%. But decode cratered.</p>

<p>Opus had an explanation ready. This was a K-quant → i-quant swap, the reverse direction from MiniMax and Step3.7, and it lost badly. So the folklore wasn’t dead, just directional: i-quant dequantization is genuinely slower on CPU, and this test had <em>isolated</em> it. That went into the repo notes as the finding.</p>

<p><strong>Step two, Q3_K_M — pure K-quant experts, no i-quant kernel involved anywhere: 4.12 tok/s.</strong></p>

<p>IQ3_XXS had measured 4.16.</p>

<p>A dead heat. Whatever slowed hy3 down had nothing to do with quant format, because the format changed completely and the number didn’t move. What both quants share is more bits per expert weight than Q2_K had.</p>

<p>That’s the real mechanism, and it should have been obvious from the first post’s own framing: <strong>cpu-moe decode is memory-bandwidth-bound.</strong> Every token streams the active experts out of DDR4. Fewer bits per weight means fewer bytes crossing the bus per token means more tokens per second. Format determines <em>quality</em> at a given size; bit-width determines <em>speed</em>. Q2_K is fast here because it is small, full stop.</p>

<p>To its credit, Opus caught this itself and retracted the rule in the repo notes without being prompted — it flagged the contradiction the moment the Q3_K_M number came in. But that’s a save, not a clean play. The rule shouldn’t have been written after one test.</p>

<p>What makes it worth writing up rather than quietly fixing: <strong>two different explanations predicted the identical result for the first test.</strong> “i-quants are slow” and “more bits are slow” both forecast a decode loss for Q2_K → IQ3_XXS. One datapoint could not tell them apart. The wrong one got picked and recorded as established. It took a second test the two hypotheses <em>disagreed</em> about — a pure K-quant at higher bit-width — to separate them.</p>

<p>When two mechanisms fit your one datapoint, you don’t have a finding. You have a coin flip you haven’t noticed you’re calling.</p>

<p>Hy3 stayed on Q3_K_M, and that one’s on me. Opus laid the trade out straight — quality up, −29% decode and −20% prefill — and asked which I wanted. I took quality on a model I use for hard single-shot questions rather than volume, and told it to skip the second perplexity run to save half an hour of box time. It’s down to about 4.1 tok/s, below reading speed and a genuinely different experience from the 5.8 it used to do. The Q2_K files went to the spare array, restorable in a <code class="language-plaintext highlighter-rouge">cp</code> if I decide that was a bad call.</p>

<h2 id="the-one-that-won-which-the-model-told-me-not-to-do">The one that won, which the model told me not to do</h2>

<p>Nemotron-3-Super was on Q4_K_M. The Q4_K_XL was only 1.1 GB bigger, and Opus probed the tensor tables before downloading anything: of 80 expert tensors, exactly <strong>three</strong> differed. Two moved Q8_1 → Q8_0, one moved Q4_K → Q5_K.</p>

<p>Its recommendation was to skip it, and the argument was good. Three tensors out of eighty, essentially no added precision, some prefill cost for the extra bytes — nothing to gain on either axis. On the evidence presented, that’s the right call.</p>

<p>I told it to run the benchmark anyway. Partly because 1.1 GB is a cheap experiment, mostly because by that point three confident predictions had already been wrong and I’d stopped trusting the reasoning ahead of the measurement.</p>

<p><strong>Decode: 8.07 → 8.70 tok/s. +7.8%.</strong> Prefill flat. The only throughput win of the entire exercise, from the swap that had been argued down to nothing.</p>

<p>The best read is that the two Q8_1 → Q8_0 tensors hit a better-optimized CPU dequantization path — a kernel-quality difference, not a precision difference. Which means the analysis was fine as far as it went and simply answered a different question than the one that mattered: <strong>a tensor-count delta tells you about quality, not about speed.</strong> Three tensors can’t add meaningful precision. Three tensors can absolutely land on a faster code path.</p>

<p>A +7.8% gain from three changed tensors is exactly the shape of a measurement artifact, so it got the full treatment before going in the table: re-run the new quant (8.69, 8.70 — reproduced), then <strong>put the old quant back and re-benchmark it under the same conditions</strong> (8.07, matching its 8.12 from before the swap). That’s the single best reason to keep the old files until the comparison is finished — without them the honest control doesn’t exist and you’re comparing against a number from a different week. Opus did this unprompted, which is the flip side of the conservatism: rigorous once measuring, just reluctant to start.</p>

<p>There’s also a mundane failure mode worth flagging if you automate this. Midway through the Nemotron run, another process on the network hit the router and evicted the model — the box serves one model at a time, so anything else using it can wipe out your benchmark. I spotted the number looked off and told it to retest. A fully unattended loop would have recorded that as data.</p>

<h2 id="the-two-rules-and-why-theyre-separate">The two rules, and why they’re separate</h2>

<p>Six measurements, one coherent picture. The costs are independent and you have to price them separately:</p>

<p><strong>Prefill ≈ bytes added.</strong> Prefill streams the entire weight set through the CPU to digest your prompt, so it pays the size increase in full and linearly.</p>

<table>
  <thead>
    <tr>
      <th>Δ size</th>
      <th>Prefill cost</th>
    </tr>
  </thead>
  <tbody>
    <tr>
      <td>+1.1 GB</td>
      <td>free</td>
    </tr>
    <tr>
      <td>+8 GB</td>
      <td>−3.7%</td>
    </tr>
    <tr>
      <td>+25 to +48 GB</td>
      <td>−15% to −20%</td>
    </tr>
  </tbody>
</table>

<p><strong>Decode ≈ expert bits-per-weight.</strong> Decode touches only the active experts per token and is bandwidth-bound, so it tracks bits, not gigabytes and not format. A big quant jump that keeps bits-per-weight similar can leave decode roughly flat (MiniMax, −1.2%) while still costing 16% of prefill. A jump that raises bits-per-weight hits decode hard (hy3, −29%).</p>

<p>Practically, for anyone running MoE models with experts in system RAM:</p>

<ol>
  <li><strong>A large quant jump is quality bought with prefill.</strong> Budget ~15% and decide if you want it. Nobody’s stopping you — just don’t expect it to be free.</li>
  <li><strong>A near-same-size tier bump is cheap and might win outright.</strong> Nemotron gained 7.8% for 1.1 GB. These are the ones worth trying.</li>
  <li><strong>Read the expert tensor types, never the tier name.</strong> “Q4_K_XL” told us nothing useful about any of these five models. What mattered was inside the file.</li>
  <li><strong>Keep the old quant until the A/B is finished.</strong> Non-negotiable. It’s the only honest control you’ll get.</li>
</ol>

<h2 id="the-trick-that-would-have-saved-us-a-144-gb-download">The trick that would have saved us a 144 GB download</h2>

<p>Rule 3 sounds like it requires downloading the thing you’re evaluating, which defeats the purpose. It doesn’t.</p>

<p>GGUF files put their tensor table near the front, and Hugging Face serves HTTP range requests. So you can pull the <strong>first ~40 MB of part 2</strong> of a split model, parse the tensor metadata out of it, and read exactly which quantization type every expert tensor uses — in seconds, without moving the other 144 GB.</p>

<p>That’s how the MXFP4 percentages in the DeepSeek table got measured. Retroactively, unfortunately — Opus wrote the probe <em>after</em> the disappointing benchmark, to explain the result. Run first, it would have said “100% MXFP4 experts” and the whole 144 GB detour wouldn’t have happened.</p>

<p>It became standard procedure immediately after, and has already paid for itself twice: it’s what produced the tensor-level detail for every model in this post, and when a promising new 152 GB model came up at the end of the session, the same probe found its architecture isn’t in any released llama.cpp build yet (the upstream PR is still an open draft). That download never started.</p>

<h2 id="what-192-gb-actually-bought">What 192 GB actually bought</h2>

<p>Not what I expected. Two of five models are genuinely better — Nemotron is faster <em>and</em> slightly higher precision, and MiniMax and Step3.7 are running quants I couldn’t fit before, at a prefill cost I can now quote exactly. DeepSeek is back on the quant it started with, but for the first time I know <em>why</em> that’s the right answer rather than the affordable one. The context windows, as covered above, stayed exactly where they were.</p>

<p>The real return was on the measurement discipline. Every table cell in my notes that we’d been treating as a baseline had quietly drifted with upstream builds — deepseek 7.12 → 6.94, minimax 8.05 → 7.46, step3.7 8.54 → 8.36, nemotron 8.60 → 8.12. Not one was a valid control anymore. Meanwhile a perplexity measurement from a build a month older reproduced to within noise (6.6996 → 6.7031), because perplexity measures weights and speed measures kernels, and only one of those changes when you rebuild.</p>

<p>Box state alone swung one decode number 14% — same model, same config, measured while a previous 137 GB memory pin was still unwinding, then again ninety seconds later. Both readings internally consistent across three runs. “Three tight runs” is not evidence of a clean measurement; it’s evidence of a stable wrong answer.</p>

<p>There was also a stretch spent chasing a load average of 1.3 during a perplexity run, which looked absurd on a 40-core box — I flagged it as obviously broken. It wasn’t: 45 of 46 threads were correctly asleep because that workload is GPU-bound. The suspicious number was the right number. Worth remembering that “this looks wrong” is a hypothesis too, and mine was the one that failed that time.</p>

<h2 id="the-context-length-you-can-hold-but-cannot-use">The context length you can hold but cannot use</h2>

<p>There’s a second thing more RAM buys, and it’s the one I’d been most excited about: context. Freeing memory means you can allocate a bigger KV cache, and several of these models advertise 256K or even 1M token windows. The temptation is to crank every <code class="language-plaintext highlighter-rouge">ctx-size</code> to its trained maximum because you finally can.</p>

<p>Don’t. Run the arithmetic first.</p>

<p>Prefill — digesting the prompt before a single token comes out — is the slow phase on this box, and unlike decode, <strong>multi-token prediction does nothing for it.</strong> DeepSeek-V4-Flash prefills at a measured 62.4 tok/s. So:</p>

<blockquote>
  <p><strong>131,072 tokens ÷ 62.4 tok/s = 2,101 seconds = 35 minutes</strong></p>
</blockquote>

<p>Thirty-five minutes of a dual-Xeon box at full tilt before the model emits its first character. The answer itself is the fast part: 500 tokens at 6.94 tok/s is another 72 seconds. <strong>Fill DeepSeek’s context to 128K and you wait ~36 minutes for a reply.</strong></p>

<p>Here’s the full table at the prefill rates measured in this post:</p>

<table>
  <thead>
    <tr>
      <th>Model</th>
      <th>Prefill</th>
      <th>32K prompt</th>
      <th>128K prompt</th>
      <th>256K prompt</th>
    </tr>
  </thead>
  <tbody>
    <tr>
      <td>gpt-oss-120B</td>
      <td>191.6 tok/s</td>
      <td>2m 51s</td>
      <td>11m 24s</td>
      <td>22m 48s</td>
    </tr>
    <tr>
      <td>Nemotron-3-Super-120B</td>
      <td>71.1 tok/s</td>
      <td>7m 40s</td>
      <td>30m 43s</td>
      <td>1h 01m</td>
    </tr>
    <tr>
      <td>Step3.7-Flash-198B</td>
      <td>65.6 tok/s</td>
      <td>8m 19s</td>
      <td>33m 18s</td>
      <td>1h 06m</td>
    </tr>
    <tr>
      <td>DeepSeek-V4-Flash-284B</td>
      <td>62.4 tok/s</td>
      <td>8m 45s</td>
      <td>35m 00s</td>
      <td>1h 10m</td>
    </tr>
    <tr>
      <td>MiniMax-M2.7-230B</td>
      <td>51.0 tok/s</td>
      <td>10m 42s</td>
      <td>42m 50s</td>
      <td>1h 25m</td>
    </tr>
    <tr>
      <td>Hy3-295B</td>
      <td>34.8 tok/s</td>
      <td>15m 41s</td>
      <td>1h 02m</td>
      <td><strong>2h 05m</strong></td>
    </tr>
  </tbody>
</table>

<p>Hy3 at its full 256K window is a <strong>two-hour</strong> wait for the first token. And note the cruel interaction with everything above: the Q3_K_M upgrade cost 20% of prefill, which on a 256K prompt is roughly 25 minutes of pure penalty added to a job that was already unreasonable.</p>

<h3 id="the-question-that-actually-settles-it">The question that actually settles it</h3>

<p>Let me put this in the terms I care about, because I don’t run these models in a vacuum — I run agents. So: <strong>just how useful is the increased intelligence I’d get from switching to DeepSeek-V4-Flash for my OpenClaw or Hermes agent with a 64K context, if the turn time became 18½ minutes instead of the 5.7 seconds I get from Qwen3.6-35B-A3B on a single RTX 5090 — 17,500 tok/s prefill and 250 tok/s generation?</strong></p>

<p>That comparison is deliberately not a datacenter card. It’s a 35B MoE with 3B active parameters on one consumer RTX 5090 — fully resident in 32 GB of VRAM, no CPU offload anywhere in the picture. Same 4-bit quantization philosophy as everything else in this series, just small enough to fit.</p>

<p>It is not cheap, mind you. That’s the ~$3,200 card in the <strong>~$5,000</strong> Ryzen box from the original post — five times what the Xeon cost. It’s been sitting there the whole series as the fast-but-expensive option. Hold that thought, it’s the actual decision at the end of this.</p>

<p>The arithmetic:</p>

<blockquote>
  <p><strong>DeepSeek-V4-Flash on the Xeon box:</strong> 65,536 ÷ 62.4 tok/s = 1,050 s = <strong>17m 30s</strong>
<strong>Qwen3.6-35B-A3B on one RTX 5090:</strong> 65,536 ÷ 17,500 tok/s = <strong>3.7 s</strong></p>
</blockquote>

<p>That’s a <strong>280× gap on prefill alone.</strong> Now add a 500-token response. Qwen generates at 250 tok/s on the Blackwell card — 2 seconds. DeepSeek does 6.94 tok/s — 72 seconds, and that’s <em>with</em> every decode optimization from the last two posts already applied.</p>

<table>
  <thead>
    <tr>
      <th> </th>
      <th>Prefill (64K)</th>
      <th>Decode (500 tok)</th>
      <th><strong>Full turn</strong></th>
    </tr>
  </thead>
  <tbody>
    <tr>
      <td>Qwen3.6-35B-A3B, one RTX 5090</td>
      <td>3.7 s</td>
      <td>2.0 s</td>
      <td><strong>5.7 s</strong></td>
    </tr>
    <tr>
      <td>DeepSeek-V4-Flash, Xeon box</td>
      <td>17m 30s</td>
      <td>1m 12s</td>
      <td><strong>18m 42s</strong></td>
    </tr>
    <tr>
      <td>Ratio</td>
      <td>280×</td>
      <td>36×</td>
      <td><strong>195×</strong></td>
    </tr>
  </tbody>
</table>

<p>Note what the decode column does to the argument. Decode is the axis I’ve spent two posts optimizing — MTP, layer offload, split modes, quant selection — and it’s only a 36× gap. Prefill is 280×. <strong>The thing I can tune is not the thing that dominates</strong>, and on a 64K agent context prefill is 94% of the turn.</p>

<p>Now run an agent, which is the whole point. Agents don’t take one turn; they take dozens, each re-reading an accumulating context of tool output, file contents, and prior reasoning. A modest 20-turn loop at 64K context:</p>

<table>
  <thead>
    <tr>
      <th> </th>
      <th>20-turn agent run</th>
    </tr>
  </thead>
  <tbody>
    <tr>
      <td>Qwen3.6-35B-A3B, one RTX 5090</td>
      <td><strong>1m 54s</strong></td>
    </tr>
    <tr>
      <td>DeepSeek-V4-Flash, Xeon box</td>
      <td><strong>6h 14m</strong></td>
    </tr>
  </tbody>
</table>

<p>Under two minutes against six and a quarter hours. That is not a slower agent, it’s a different category of object — one you supervise interactively, and one you launch before bed and read about in the morning.</p>

<p>So is DeepSeek-V4-Flash <em>smarter</em> than Qwen3.6-35B-A3B? On a lot of tasks, honestly, yes — 284B total against 35B, 13B active against 3B, and you can feel it on hard reasoning. <strong>It does not matter.</strong> No plausible intelligence gain survives a 195× turn-time penalty in an agentic loop, because agents convert latency into wall-clock multiplicatively. A slightly worse answer in 6 seconds beats a better answer in 19 minutes every time you’re going to ask 20 more questions after it. The only regime where the big model wins is the one-shot hard question you’re willing to wait on — and notice that’s precisely <em>not</em> an agent workload.</p>

<p>And the mechanism behind that 195× is the same trick this whole series is built on. <strong><code class="language-plaintext highlighter-rouge">--cpu-moe</code> is what makes 284B parameters <em>possible</em> on cheap hardware, and it is exactly what makes them unusable in a loop.</strong> Experts streaming out of DDR4 is a brilliant answer to “can I run this at all” and a terrible answer to “can I run this forty times in a row.” The 5090 wins here for one reason: it never touches system RAM.</p>

<p>Which brings back the price tag. At ~$5,000 for the Ryzen build against ~$1,000 for the Xeon, this is emphatically not “cheap hardware loses to expensive hardware.” It’s two genuinely different purchases that happen to share a name:</p>

<ul>
  <li><strong>$1,000 buys capability.</strong> 200B-class models you otherwise could not run at all, at conversational speed, one question at a time. Nothing that fits in the 5090’s 32 GB touches DeepSeek-V4-Flash on a hard problem — that model doesn’t fit on that card at any quantization, so this isn’t a speed tradeoff, it’s the difference between <em>having the option</em> and not.</li>
  <li><strong>$5,000 buys throughput.</strong> A smaller model that answers in seconds, over and over, without complaint. That is what an agent actually consumes.</li>
</ul>

<p>5× the money for a model with 1/8th the parameters, and for agentic work it is the correct buy. That sentence should feel wrong and doesn’t, which is the whole lesson: you are not buying intelligence per dollar, you are buying <em>the shape of the latency curve</em> your workload rides on.</p>

<p>Neither box is a mistake. They answer different questions, and the trap is assuming money spent on one buys you the other. I spent $50 expecting to improve my agent stack and improved something else entirely — a fine outcome, just not the one I’d budgeted for.</p>

<p><strong>Model quality is what you shop for when latency is roughly comparable. When latency differs by two orders of magnitude, latency is the only spec that matters</strong> — and prefill speed, not decode speed and not parameter count, is what sets it for anything that reads before it writes.</p>

<h3 id="so-what-is-a-big-context-window-for-then">So what is a big context window for, then?</h3>

<p><strong>It’s a ceiling, not a workload.</strong> The value is that a long conversation or a document-plus-history session doesn’t hit a wall and truncate. You get there <em>incrementally</em> — a few thousand tokens per turn, each turn’s prefill measured in seconds — and llama.cpp caches the prefix, so turn 40 only re-processes what turn 40 added. That prefix cache is what makes local long-context usable at all, and it’s also exactly what an agent defeats: agents rewrite their context, so the cache misses and you pay full prefill again. Accumulating to 100K over an afternoon of chat is completely fine. <strong>Arriving at 100K in one paste, or churning it every turn, is not.</strong></p>

<p>The practical rule I’ve landed on: <strong>on this box, prompts should be under ~10K tokens for interactive work</strong> (about 2½ minutes of prefill on the slow models, tolerable) and long context should be reached by conversation, not by upload. Anything where you genuinely need to dump 100K tokens of fresh material and get an answer — full-repo analysis, a long PDF, bulk document extraction — is the exact workload this hardware is worst at, and it’s worth being honest that a cloud API or a Blackwell card will do it in seconds. <strong>Agentic workloads sit squarely in the bad category</strong> and belong on the fast GPU regardless of how much smarter the big model is.</p>

<p>This is also why I declined to raise any context windows during this session, despite now having the memory to do it. The KV cache would fit. The wait wouldn’t. More RAM bought better <em>weights</em>, not usable <em>context</em> — and it took doing the division to see that those are separate purchases.</p>

<h2 id="what-id-tell-someone-handing-a-box-to-a-model">What I’d tell someone handing a box to a model</h2>

<p>The autonomy worked, with a shape to it. Opus was better than I would have been at the parts that are tedious and unglamorous: capturing fresh controls instead of reusing stale ones, re-running surprising results, reloading an old quant to get an honest A/B, retracting its own rule when a later test contradicted it, writing all of it down as it went. That’s most of the actual work, and it’s exactly the part humans skip at 11pm.</p>

<p>What it needed from me was appetite. Left alone it converged on the defensible choice — the middle tier, the skipped benchmark, the well-argued “nothing to gain here.” Three of my five interventions were just <em>run it anyway</em>, and one of those produced the only speed win of the entire exercise. The other two were about optionality: archive the rejected quant instead of deleting it, keep the old files until the comparison is done.</p>

<p>Which sounds like a knock and isn’t, quite. A model that only proposes well-justified experiments is a good property when it’s driving your production box unattended. It just means the human’s job shifts from doing the work to deciding which unjustified experiments are cheap enough to run anyway. On a $1,000 box with a spare 1.5 TB array, that bar is low.</p>

<p>The thesis from the first post still holds and got a little sharper. Frontier-scale local inference isn’t a hardware problem, it’s a patience-and-tuning problem — and this round the tuning mostly consisted of discovering that four confident predictions, several of them from rules in my own notes, were wrong. The box serves 48 models today on the same $1,000 of eBay parts, plus $50 of DDR4 I’d forgotten I owned.</p>

<p>Which, at current Marketplace prices, means the upgrade carried an opportunity cost of about $600. I regret nothing.</p>]]></content><author><name>Jim Smith</name></author><category term="AI Technology" /><category term="llama-cpp" /><category term="quantization" /><category term="gguf" /><category term="moe" /><category term="cpu-offload" /><category term="mxfp4" /><category term="deepseek" /><category term="hunyuan" /><category term="minimax" /><category term="nemotron" /><category term="local-llm" /><category term="pascal" /><category term="budget" /><summary type="html"><![CDATA[Adding $50 of forgotten DDR4 to a $1,000 eBay Xeon box: four of five quant upgrades made models slower, and the only win was the one the model said to skip.]]></summary></entry><entry><title type="html">The $1,000 Box, One Month On: A Model Zoo and Multi-Token Prediction</title><link href="https://joshua8.ai/1000-box-one-month-mtp-model-zoo/" rel="alternate" type="text/html" title="The $1,000 Box, One Month On: A Model Zoo and Multi-Token Prediction" /><published>2026-07-20T00:00:00+00:00</published><updated>2026-07-20T00:00:00+00:00</updated><id>https://joshua8.ai/1000-box-one-month-mtp-model-zoo</id><content type="html" xml:base="https://joshua8.ai/1000-box-one-month-mtp-model-zoo/"><![CDATA[<p><img src="/images/200b-ebay-hardware.png" alt="200 billion parameters for $1,000 — running large MoE models on budget eBay hardware" /></p>

<p><em>A follow-on to <a href="/200b-parameters-1000-ebay-hardware/">200 Billion Parameters for $1,000: Running 4-Bit Quants on eBay Hardware</a>.</em></p>

<p><em>Follow-up: <a href="/junk-drawer-upgrade-64gb-ddr4-quantization/">The Junk Drawer Upgrade: What 64 GB of Forgotten DDR4 Taught Me About Quantization</a> — $50 of found DDR4, and four of five quant upgrades made the models slower.</em></p>

<h2 id="tldr">TL;DR</h2>

<p>When we first wired up the $1,000 Xeon box — dual 2016-vintage E5-2698 v4s, 128 GB of DDR4, and a pair of $250 Quadro P5000s — it ran three big MoE models at faster-than-you-read speeds. Nothing in that hardware has changed. Today the same ~$1000 box serves <strong>44 models</strong>, including four 200B-plus giants the original post never mentioned: DeepSeek-V4-Flash (284B), Tencent’s Hunyuan Hy3 (295B), MiniMax-M2.7 (230B), and Step3.7-Flash (198B). The bigger story is <strong>multi-token prediction (MTP)</strong> — letting a model draft its own next few tokens and verify them in a single pass. On our flagship Qwen3.5-122B it lifted decode from 11 to 17 tok/s (+52%); on dense 27B models it nearly doubled throughput, and a coder model hit 58 tok/s at 96–99% draft acceptance. The catch: MTP only pays when acceptance is high. On a cheap MoE it’s a <em>net slowdown</em>. Measure acceptance, not architecture.</p>

<h2 id="the-zoo-grew--same-box-no-new-hardware">The zoo grew — same box, no new hardware</h2>

<p>The original piece made a narrow claim: for about $1,000 of eBay parts you can run a handful of 4-bit, 200B-class MoE models locally, trading concurrency and prefill speed for access. A month of nights-and-weekends later, that same chassis is a router in front of <strong>44 distinct model presets</strong> — dense chat models, OCR pipelines, embedding and rerank endpoints, and a shelf of frontier-scale MoEs loaded on demand.</p>

<p>The heavyweights are the headline. All of these decode on the same 40 cores, with their expert tensors parked in system RAM (<code class="language-plaintext highlighter-rouge">--cpu-moe</code>) while attention and the KV cache ride the two 16 GB Pascal cards:</p>

<table>
  <thead>
    <tr>
      <th>Model</th>
      <th>Total / active</th>
      <th>Decode</th>
      <th>Prefill</th>
    </tr>
  </thead>
  <tbody>
    <tr>
      <td>DeepSeek-V4-Flash</td>
      <td>284B / 13B</td>
      <td><strong>7.4</strong> tok/s</td>
      <td>62 tok/s</td>
    </tr>
    <tr>
      <td>Hunyuan Hy3</td>
      <td>295B / 21B</td>
      <td>5.7 tok/s</td>
      <td>43 tok/s</td>
    </tr>
    <tr>
      <td>MiniMax-M2.7</td>
      <td>230B / 10B</td>
      <td>8.1 tok/s</td>
      <td>60 tok/s</td>
    </tr>
    <tr>
      <td>Step3.7-Flash</td>
      <td>198B / —</td>
      <td>8.5 tok/s</td>
      <td>77 tok/s</td>
    </tr>
    <tr>
      <td>Nemotron-3-Super</td>
      <td>120B</td>
      <td>8.6 tok/s</td>
      <td>70 tok/s</td>
    </tr>
    <tr>
      <td>gpt-oss</td>
      <td>120B</td>
      <td>13.6 tok/s</td>
      <td>192 tok/s</td>
    </tr>
  </tbody>
</table>

<p>Note the pattern the original post predicted and this table confirms: <strong>active parameters, not total, set decode speed.</strong> Hy3’s 21B-active experts make it the slowest thing in the rack despite not being the largest. DeepSeek-V4-Flash’s 13B-active MLA gets it to 7.4 — and a single upstream patch (fused hyper-connection ops, llama.cpp #25585) bumped it there from 5.2, a free +42% for the cost of a rebuild.</p>

<h2 id="mtp-the-model-drafts-then-checks-its-own-work">MTP: the model drafts, then checks its own work</h2>

<p>The interesting lever since the last post is <strong>multi-token prediction</strong>, a flavor of speculative decoding. Instead of a separate draft model, the newer Qwen3.6, Hy3, and Qwen3.5-122B GGUFs bundle a tiny “NextN” head inside the file. That head proposes the next few tokens; the full model verifies them in one forward pass. Every accepted guess is a token you got almost for free. Because verification is batched and our cpu-moe models are memory-bandwidth-bound, that extra check costs almost nothing — the win is close to pure.</p>

<p>The numbers on our slow box:</p>

<ul>
  <li><strong>Qwen3.5-122B</strong>, the flagship: 11.1 → <strong>16.9 tok/s (+52%)</strong>, with 90–96% draft acceptance. This is the single biggest quality-of-life change since launch — the original “about 10 tok/s, faster than you read” is now comfortably past 15.</li>
  <li><strong>Dense 27B models</strong>: <code class="language-plaintext highlighter-rouge">qwen3.6:27b</code> went 12.7 → <strong>24.0 (~1.9×)</strong> at 95.7% accept; the coder variant, 13.2 → 24.6.</li>
  <li><strong>A 3B-active coder MoE</strong>: <code class="language-plaintext highlighter-rouge">qwopus3.6:35b-coder</code> reaches <strong>58 tok/s</strong> with MTP on, riding 96–99% acceptance on actual code.</li>
</ul>

<h2 id="the-catch-acceptance-decides-not-architecture">The catch: acceptance decides, not architecture</h2>

<p>MTP is not free money. It wins only when the draft head is usually <em>right</em> — high acceptance amortizes the verification pass. When acceptance is low, you pay for guesses you throw away.</p>

<p>We learned this twice. First, turning MTP on for Gemma4-26B — a cheap 3B-active MoE — was a <strong>net slowdown</strong>, 45 → 33 tok/s: the model already decodes cheaply, so draft overhead swamped the gain. Second, Hy3 shipped at ~44% acceptance and sat exactly at break-even (4.96 tok/s, tied with the non-MTP control). The fix wasn’t more drafting — it was <em>less</em>. Setting <code class="language-plaintext highlighter-rouge">spec-draft-p-min = 0.75</code>, so the head only drafts tokens it’s confident about, pushed acceptance to 83–87% and nudged decode to 5.12. The coder’s 96–99% is why a low-active MoE that “should” lose with MTP wins big instead: on code, the next token is nearly always predictable.</p>

<p>So the rule from a month of benchmarking is blunt: <strong>measure acceptance for your workload before trusting MTP.</strong> Coding and QA love it; creative writing can actually regress. Architecture is a weak predictor.</p>

<h2 id="prefill-is-still-the-tax">Prefill is still the tax</h2>

<p>None of this fixes the original post’s honest caveat: prefill on old CPUs is slow, and cpu-moe makes it slower. The 200B-class models still ingest context at 40–80 tok/s, so a long document is a coffee break. MTP helps decode, not prefill — the draft head is tiny and adds nothing to the prompt pass. If your use is single-user, conversational, and decode-bound, the box has quietly gotten 50–90% faster on the same silicon. If you feed it 40K-token prompts all day, the answer is the same as it was: buy newer cores, or wait.</p>

<p>The thesis holds, and got cheaper per token: frontier-scale local inference isn’t a hardware problem. It’s a patience-and-tuning problem — and the tuning keeps paying off.</p>]]></content><author><name>Jim Smith</name></author><category term="AI Technology" /><category term="llama-cpp" /><category term="qwen" /><category term="deepseek" /><category term="hunyuan" /><category term="minimax" /><category term="moe" /><category term="cpu-offload" /><category term="multi-token-prediction" /><category term="speculative-decoding" /><category term="local-llm" /><category term="pascal" /><category term="budget" /><summary type="html"><![CDATA[The same $1,000 eBay Xeon box now serves 44 models, including four 200B-plus giants. Multi-token prediction lifted Qwen3.5-122B decode 52% — but only where draft acceptance is high.]]></summary></entry><entry><title type="html">Evicting the Vision Encoder to the CPU (and Why We Shipped None of It)</title><link href="https://joshua8.ai/two-5070ti-part3-cpu-vision-sidecar/" rel="alternate" type="text/html" title="Evicting the Vision Encoder to the CPU (and Why We Shipped None of It)" /><published>2026-07-07T00:00:00+00:00</published><updated>2026-07-07T00:00:00+00:00</updated><id>https://joshua8.ai/two-5070ti-part3-cpu-vision-sidecar</id><content type="html" xml:base="https://joshua8.ai/two-5070ti-part3-cpu-vision-sidecar/"><![CDATA[<p><img src="/images/two-5070ti-part3.png" alt="The CPU vision sidecar — evicting Qwen3.6's vision encoder from two RTX 5070 Tis" /></p>

<p><em>Two 5070 Tis, one 35B model — Part 3 of 3: the CPU vision sidecar, the OOM that freed memory, and the production decision</em></p>

<h2 id="tldr">TL;DR</h2>

<p>Qwen3.6 is multimodal: it carries a BF16 vision transformer (ViT) that, under tensor parallelism, gets replicated on <em>both</em> 16 GB cards and OOMs image requests. Our fix was to evict the ViT from the GPU entirely: a CPU vision sidecar. A small FastAPI proxy intercepts image requests, runs the vision tower on the CPU with plain <code class="language-plaintext highlighter-rouge">transformers</code>, and forwards precomputed <code class="language-plaintext highlighter-rouge">image_embeds</code> to vLLM, which we tell to skip loading its own ViT via <code class="language-plaintext highlighter-rouge">--enable-mm-embeds</code>. It passed a 7/7 exact-parity check (including three <em>identical</em> misreads, proving the CPU tower is functionally the same model), and it did something nothing else could: it made NVFP4 run under tensor parallelism with working images for the first time. It also taught us a nasty lesson: freeing VRAM can <em>crash</em> a hybrid model, because the profiler hands the freed memory to the KV cache and starves the GDN activation scratch. And after all that, we chose <strong>not</strong> to ship it. Here’s why all of that is true at once.</p>

<hr />

<h2 id="the-problem-the-vit-creates">The problem the ViT creates</h2>

<p>Recap from <a href="/two-5070ti-part1-pipeline-vs-tensor-parallel/">Part 1</a>: under tensor parallelism the vision tower is replicated per card, so an image request inflates memory symmetrically on both GPUs and OOMs them together. Under pipeline parallelism the ViT lives on rank 0 only, which is why PP can serve images and TP can’t. On 16 GB cards already 85%+ full of weights, the resident ViT is the margin between working and dead.</p>

<p>But notice what that implies: the ViT is <em>in the way</em>. It occupies VRAM on the critical card, it blocks TP, and, for a MoE language model, it’s a comparatively small, embarrassingly CPU-friendly piece of compute that runs <em>once per image</em>, not once per token. What if it just… weren’t on the GPU?</p>

<h2 id="the-sidecar-architecture">The sidecar architecture</h2>

<p>vLLM has a feature built for exactly this: <code class="language-plaintext highlighter-rouge">--enable-mm-embeds</code>. It lets a client send precomputed multimodal embeddings instead of raw pixels. Pair it with <code class="language-plaintext highlighter-rouge">--limit-mm-per-prompt '{"image":0,"video":0}'</code> and vLLM stubs out its vision tower entirely: the ViT weights are never loaded. The GPU gets that memory back.</p>

<p>Something still has to turn pixels into embeddings. That’s the sidecar:</p>

<div class="language-plaintext highlighter-rouge"><div class="highlight"><pre class="highlight"><code>client ──image_url──▶  vision-sidecar (:8006)  ──image_embeds──▶  vLLM (:8005)
                        │  FastAPI proxy
                        │  transformers Qwen3_5MoeVisionModel
                        │  CPU, 16 threads, BF16
                        └─ rewrites the chat request in flight
</code></pre></div></div>

<p>The proxy is a drop-in shim in front of vLLM. It watches chat completions for <code class="language-plaintext highlighter-rouge">image_url</code> content parts; when it sees one, it downloads the image, runs the CPU vision tower, serializes the resulting embedding tensor, and rewrites that content part into an <code class="language-plaintext highlighter-rouge">image_embeds</code> part before passing the request along. Text-only requests pass straight through untouched. To the client it’s just an OpenAI-compatible endpoint; to vLLM it’s a text-only model receiving embeddings.</p>

<p>The sidecar loads <em>only</em> the vision weights: it reads the model’s <code class="language-plaintext highlighter-rouge">safetensors</code> index and pulls just the <code class="language-plaintext highlighter-rouge">model.visual.*</code> shards into a <code class="language-plaintext highlighter-rouge">transformers</code> <code class="language-plaintext highlighter-rouge">Qwen3_5MoeVisionModel</code>. One subtlety worth calling out: the visual weights live on different shards in different checkpoints (shard 9/10 in the AutoRound build, shard 1/3 in NVFP4), so the loader auto-detects them from the weight index rather than hardcoding a shard number. That one change is what let the <em>same</em> sidecar serve both builds.</p>

<h2 id="the-wire-format-gotchas">The wire-format gotchas</h2>

<p>Getting the embeddings into vLLM correctly took two specific fixes that are easy to get wrong and produce opaque errors.</p>

<p><strong>The embedding payload.</strong> Each rewritten content part looks like:</p>

<div class="language-json highlighter-rouge"><div class="highlight"><pre class="highlight"><code><span class="p">{</span><span class="nl">"type"</span><span class="p">:</span><span class="w"> </span><span class="s2">"image_embeds"</span><span class="p">,</span><span class="w">
 </span><span class="nl">"image_embeds"</span><span class="p">:</span><span class="w"> </span><span class="p">{</span><span class="nl">"image_embeds"</span><span class="p">:</span><span class="w"> </span><span class="s2">"&lt;b64 torch.save of [n_tokens, 2048] bf16&gt;"</span><span class="p">,</span><span class="w">
                  </span><span class="nl">"image_grid_thw"</span><span class="p">:</span><span class="w"> </span><span class="s2">"&lt;b64 torch.save of the grid shape&gt;"</span><span class="p">}}</span><span class="w">
</span></code></pre></div></div>

<p><strong>The <code class="language-plaintext highlighter-rouge">grid_thw</code> shape trap.</strong> The grid-shape tensor must be a per-item 1-D tensor of shape <code class="language-plaintext highlighter-rouge">[3]</code>, <em>not</em> <code class="language-plaintext highlighter-rouge">[1, 3]</code>. vLLM’s <code class="language-plaintext highlighter-rouge">chat_utils._merge_embeds</code> stacks the parts and adds the batch dimension itself; hand it <code class="language-plaintext highlighter-rouge">[1, 3]</code> and you get a 400 error (<code class="language-plaintext highlighter-rouge">size_per_item should be a 1-D tensor</code>) with nothing pointing you at the extra dimension. Squeeze it to <code class="language-plaintext highlighter-rouge">[3]</code> and it works. Hours can disappear into that one.</p>

<h2 id="does-the-embedding-ever-go-back-to-the-gpu">“Does the embedding ever go back to the GPU?”</h2>

<p>A fair question, and the answer is yes, and it clarifies exactly what the sidecar does and doesn’t move off the GPU.</p>

<p>Only the pixel → embedding <em>computation</em> happens on the CPU. The resulting embedding tensor is sent to vLLM, and vLLM copies it onto the GPU (<code class="language-plaintext highlighter-rouge">pe_tensor.to(self.device)</code> in the model runner) so it can be spliced into the token stream and attended over by the language model, which is entirely on the GPU. The sidecar doesn’t move the <em>language</em> model’s work to the CPU, which would be catastrophic. It moves only the one-shot vision encode, whose output is a modest <code class="language-plaintext highlighter-rouge">[n_tokens, 2048]</code> tensor that rides back to the GPU cheaply. The heavy, per-token transformer stays where it belongs.</p>

<h2 id="proving-its-the-same-model">Proving it’s the same model</h2>

<p>Offloading a model component to a different framework (<code class="language-plaintext highlighter-rouge">transformers</code> on CPU vs vLLM’s own ViT on GPU) invites the fear that you’ve subtly changed the model’s behavior. We ran a same-boot A/B parity probe: identical images through the native GPU ViT and through the CPU sidecar, comparing the model’s actual text output.</p>

<p><strong>7/7 exact match.</strong> The most convincing evidence wasn’t the correct reads. It was the <em>incorrect</em> ones. On three hard 120-pixel words the model misread the text, and the CPU sidecar produced the exact same three misreads (PERFECT/TPR/CORE) as the native GPU tower. Two independent implementations agreeing on the right answer is reassuring; two implementations making the <em>same mistakes</em> is proof they’re computing the same function. Needle-in-a-haystack retrieval held at 8/8 up to 192K context with concurrent image traffic. The CPU tower is the GPU tower.</p>

<p>The cost: CPU encoding runs about <strong>3.2 seconds per megapixel</strong>, capped at ~1.1 MP (<code class="language-plaintext highlighter-rouge">MAX_PIXELS</code>) to bound latency. Sixteen encoder threads was the sweet spot on this hybrid P/E-core CPU; 24 threads was <em>slower</em>, because the extra threads land on efficiency cores and drag the batch.</p>

<h2 id="the-oom-that-freeing-memory-caused">The OOM that freeing memory caused</h2>

<p>This is where it got strange. We unloaded the ViT expecting free VRAM and a happier engine. Instead the first 32K-token prefill OOM’d in a GDN kernel (<code class="language-plaintext highlighter-rouge">chunk_fwd_o</code>) and killed the engine.</p>

<p>The cause is a subtlety of hybrid models plus how vLLM sizes its cache. When the ViT stopped loading, ~1.5 GiB freed up on the critical card. vLLM’s memory profiler saw that free space and grew the KV cache pool to absorb it — from 196,608 tokens all the way to 481,689. But the GDN linear-attention layers need a chunk of <em>activation scratch</em> at prefill time (<code class="language-plaintext highlighter-rouge">chunk_gated_delta_rule</code> / <code class="language-plaintext highlighter-rouge">chunk_fwd_o</code>) that the profiler’s steady-state snapshot doesn’t fully account for. The ballooned KV pool ate the headroom that scratch needed, and the first real long prefill ran the card out of memory.</p>

<p>The instinct, “just cap the KV cache with <code class="language-plaintext highlighter-rouge">--kv-cache-memory-bytes</code>,” makes it worse on this hybrid model. That flag budgets only the paged KV; the mamba/GDN state cache lands <em>on top</em> of the budget, and we watched a card drop to 21 MiB free and OOM during cudagraph warmup. The only knob that behaves correctly is <code class="language-plaintext highlighter-rouge">--gpu-memory-utilization</code>, because it caps <em>total</em> usage and leaves the GDN scratch its implicit slack. Dropping util from 0.92 to <strong>0.85</strong> fixed it: a 267,386-token pool (still 1.36× the original) with ~2.7 GiB genuinely free for GDN scratch.</p>

<p>The same trap, worse, hit NVFP4 under TP: util 0.92 with the ViT unloaded ballooned the pool to 699,347 tokens and left 31 MiB free → cudagraph-capture OOM. Util 0.85 fixed it there too, though the margin stayed thin (176 MiB free on a near-ceiling prefill), which is why 0.82–0.83 would be the safer production number for that build.</p>

<p><strong>Lesson: on a GDN/mamba hybrid, freeing VRAM is not automatically safe. The profiler will spend it on KV cache and starve the linear-attention scratch. Util is the only headroom knob that respects the hybrid.</strong></p>

<h2 id="the-payoff-nvfp4-under-tensor-parallelism">The payoff: NVFP4 under tensor parallelism</h2>

<p>The best result the sidecar bought us: with the ViT off the GPU, we ran the NVFP4/b12x model under TP=2 with working images — something that had never worked before, because the replicated ViT always OOM’d it (<a href="/two-5070ti-part1-pipeline-vs-tensor-parallel/">Part 1</a>). On the <code class="language-plaintext highlighter-rouge">dev552</code> pin (<a href="/two-5070ti-part2-nightly-bisect-nvfp4/">Part 2</a>), text stayed coherent under sharding, images worked, b12x stayed engaged, and the KV pool hit <strong>489,739 tokens (2.72×)</strong> with prefill ~7,700 tok/s and warm decode ~166 tok/s. The vision-tower blocker that made TP a non-starter for the multimodal model was simply gone.</p>

<table>
  <thead>
    <tr>
      <th>Config</th>
      <th>ViT location</th>
      <th style="text-align: center">Images under TP?</th>
      <th style="text-align: right">KV pool</th>
      <th>Note</th>
    </tr>
  </thead>
  <tbody>
    <tr>
      <td>PP=2, native ViT</td>
      <td>GPU rank 0</td>
      <td style="text-align: center">n/a (PP)</td>
      <td style="text-align: right">196,608</td>
      <td>production</td>
    </tr>
    <tr>
      <td>TP=2, native ViT</td>
      <td>replicated both cards</td>
      <td style="text-align: center">❌ OOM</td>
      <td style="text-align: right">—</td>
      <td>blocked</td>
    </tr>
    <tr>
      <td>TP=2, <strong>CPU sidecar</strong></td>
      <td>CPU</td>
      <td style="text-align: center">✅</td>
      <td style="text-align: right">503,316</td>
      <td>AutoRound</td>
    </tr>
    <tr>
      <td><strong>NVFP4 TP=2, CPU sidecar</strong></td>
      <td>CPU</td>
      <td style="text-align: center">✅ <strong>(first ever)</strong></td>
      <td style="text-align: right">489,739</td>
      <td>dev552 pin</td>
    </tr>
  </tbody>
</table>

<h2 id="why-we-shipped-none-of-it">Why we shipped none of it</h2>

<p>And then production went back to <strong>AutoRound INT4, PP=2, native in-vLLM ViT</strong> — the sidecar switched off. That’s not a walk-back; it’s the workload talking.</p>

<ul>
  <li>The production client sends large images — ~16K vision tokens each. The CPU sidecar caps at ~1.1 MP to keep latency sane, which would <em>downscale the client’s images</em>; uncapped, a single large image takes ~50 s to encode on CPU. For this client, native GPU encoding is both faster and lossless.</li>
  <li>PP runs the ViT natively on rank 0 with no OOM anyway. The problem the sidecar solves — ViT replication — is a <em>TP</em> problem. Production is PP. There’s nothing to fix.</li>
  <li>The workload is prefill-heavy, and PP’s prefill is 1.9× TP’s (<a href="/two-5070ti-part1-pipeline-vs-tensor-parallel/">Part 1</a>). The sidecar’s whole reason to exist is to unlock TP’s bigger KV cache, which this workload doesn’t need.</li>
  <li>AutoRound rides the latest nightly; NVFP4 is frozen on <code class="language-plaintext highlighter-rouge">dev552</code> until the upstream sharding regression is fixed (<a href="/two-5070ti-part2-nightly-bisect-nvfp4/">Part 2</a>). Staying on AutoRound keeps us current.</li>
</ul>

<p>So the sidecar, the NVFP4-under-TP result, and the 256K-context experiments it enabled are all validated capabilities on the shelf, not the running config. They’re the answer if the workload changes — text-heavy, high-concurrency, very-long-context, or the day #47365 gets fixed. Building them taught us more about this model’s memory behavior than any amount of reading would have. But the production box runs the boring, proven thing: INT4, pipeline-parallel, vision tower on the GPU where the client’s big images want it, 196,608 tokens of context, both cards busy, clean boots.</p>

<p>The best engineering outcome of a three-week investigation was knowing precisely <em>why</em> to keep doing what we were already doing — and having a validated escape hatch built for the day that stops being true.</p>

<h2 id="a-closing-note">A closing note</h2>

<p>I should say who actually wrote this thing. The series opened with four developers and a toddler all running out of tokens on the same afternoon. I wasn’t one of them; I still had room left on my Fable plan, the same shiny new model that had drained everyone else’s quota by lunchtime.</p>

<p>So Fable wrote the sidecar. It read through the vLLM internals, wrote the encoder, hit the <code class="language-plaintext highlighter-rouge">[1,3]</code>-vs-<code class="language-plaintext highlighter-rouge">[3]</code> wall and got past it, and worked out why unloading the ViT was blowing up the GDN memory profiler. I aimed it at the problem, argued with it, and made the calls about what to ship. But the code is the model’s.</p>

<p>Which is a little funny, given the point of the whole project. The reason you build your own inference box is so you’re not at the mercy of someone else’s quota, and the only reason this particular box got built is that, that afternoon, I hadn’t hit mine. The escape hatch got built with the exact thing everyone else had just run out of. My granddaughter, for the record, was still at Zelky’s.</p>

<hr />

<p><em>This concludes the 3-part series. <a href="/two-5070ti-part1-pipeline-vs-tensor-parallel/">Part 1</a> covered pipeline vs tensor parallelism on no-P2P consumer Blackwell; <a href="/two-5070ti-part2-nightly-bisect-nvfp4/">Part 2</a> covered bisecting vLLM nightlies and the SM120 FP4 crash fix; Part 3 covered the CPU vision sidecar and the production decision.</em></p>]]></content><author><name>Jim Smith</name></author><category term="AI Technology" /><category term="vllm" /><category term="qwen" /><category term="multimodal" /><category term="vision" /><category term="tensor-parallel" /><category term="blackwell" /><category term="5070ti" /><category term="local-llm" /><category term="moe" /><summary type="html"><![CDATA[How a FastAPI CPU vision sidecar freed VRAM, unlocked NVFP4 under tensor parallelism on two RTX 5070 Tis, and why the boring config still won production.]]></summary></entry><entry><title type="html">The Nightly From Hell: Bisecting vLLM to Find a Working NVFP4 Build</title><link href="https://joshua8.ai/two-5070ti-part2-nightly-bisect-nvfp4/" rel="alternate" type="text/html" title="The Nightly From Hell: Bisecting vLLM to Find a Working NVFP4 Build" /><published>2026-07-06T00:00:00+00:00</published><updated>2026-07-06T00:00:00+00:00</updated><id>https://joshua8.ai/two-5070ti-part2-nightly-bisect-nvfp4</id><content type="html" xml:base="https://joshua8.ai/two-5070ti-part2-nightly-bisect-nvfp4/"><![CDATA[<p><img src="/images/two-5070ti-part2.png" alt="Bisecting vLLM nightlies to find a working NVFP4 build on two RTX 5070 Tis" /></p>

<p><em>Two 5070 Tis, one 35B model — Part 2 of 3: bisecting vLLM and diagnosing SM120</em></p>

<h2 id="tldr">TL;DR</h2>

<p>Native FP4 (NVFP4) is the format Blackwell was built for, and Qwen3.6-35B ships an NVFP4 checkpoint. Getting it to <em>run</em> on two consumer RTX 5070 Ti cards took two separate battles. First, a crash: on SM120 the FP4 GEMM throws an “illegal instruction” unless you feed FlashInfer three specific environment variables that select the <code class="language-plaintext highlighter-rouge">120f</code> code path, undocumented tribal knowledge without which the model won’t load. Second, a correctness regression: the <code class="language-plaintext highlighter-rouge">:nightly</code> vLLM image produced pure garbage (empty completions and <code class="language-plaintext highlighter-rouge">&lt;|box_end|&gt;</code> spam) under our sharded config. We bisected nine daily nightly builds to pin the regression to a 49-commit window, ruled out the obvious suspects, and froze production on the last good pin. Along the way we root-caused a recurring ~17-second engine freeze to GDN kernel JIT recompilation. This is the debugging story.</p>

<hr />

<h2 id="why-bother-with-nvfp4-at-all">Why bother with NVFP4 at all</h2>

<p>The production model (<a href="/two-5070ti-part1-pipeline-vs-tensor-parallel/">Part 1</a>) is Intel AutoRound INT4. It works, it’s stable, it stays on the latest nightly. So why chase a second, fussier build?</p>

<p>Because NVFP4 is native to the hardware. Blackwell’s tensor cores have first-class FP4 support; <code class="language-plaintext highlighter-rouge">nvidia/Qwen3.6-35B-A3B-NVFP4</code> is a mixed-precision checkpoint (W4A16 NVFP4 experts + FP8 attention/KV) designed to hit the <code class="language-plaintext highlighter-rouge">flashinfer_b12x</code> MoE kernel, a native-FP4 path that on paper should be the fastest way to run this model on this silicon. If it lived up to that, it’d be the better production build. Finding out whether it did meant getting it stable first. That’s where the trouble started.</p>

<h2 id="battle-1-the-sm120-illegal-instruction">Battle 1: the SM120 “illegal instruction”</h2>

<p>The very first boot didn’t produce wrong answers. It <em>crashed</em>, hard, with an illegal-instruction fault inside the FP4 GEMM. This is the kind of failure that eats an afternoon because it looks like a broken build when it’s actually a missing incantation.</p>

<p>Consumer Blackwell (SM120) comes in two ISA flavors that FlashInfer distinguishes as <code class="language-plaintext highlighter-rouge">120a</code> and <code class="language-plaintext highlighter-rouge">120f</code>. The <code class="language-plaintext highlighter-rouge">120a</code> variant lacks the TMA warp-specialized grouped GEMM that the FP4 path wants; route the FP4 GEMM through it and you get an illegal instruction. The fix is to force FlashInfer onto the <code class="language-plaintext highlighter-rouge">120f</code> code path with three environment variables, all required together:</p>

<div class="language-yaml highlighter-rouge"><div class="highlight"><pre class="highlight"><code><span class="pi">-</span> <span class="s">FLASHINFER_CUDA_ARCH_LIST=12.0f</span>
<span class="pi">-</span> <span class="s">FLASHINFER_FORCE_SM=120f</span>
<span class="pi">-</span> <span class="s">FLASHINFER_DISABLE_VERSION_CHECK=1</span>
</code></pre></div></div>

<p>That last one matters because the pinned FlashInfer build’s version string doesn’t match what vLLM expects, and the check aborts otherwise. None of this is in a getting-started guide; it’s assembled from issue threads and one working reference deployment. Miss any of the three and the model either crashes or silently refuses the native path.</p>

<p>And selecting the native path is itself a choice you have to make explicitly:</p>

<div class="language-yaml highlighter-rouge"><div class="highlight"><pre class="highlight"><code><span class="pi">-</span> <span class="s">--moe-backend=flashinfer_b12x</span>
</code></pre></div></div>

<p>Leaving it on <code class="language-plaintext highlighter-rouge">auto</code> lets vLLM pick the <code class="language-plaintext highlighter-rouge">flashinfer_cutlass</code> FP4 MoE path, which is broken on SM120. Two more traps sit right next to it: do <strong>not</strong> set <code class="language-plaintext highlighter-rouge">VLLM_USE_FLASHINFER_MOE_FP4=1</code> (routes to the broken cutlass MoE), and do <strong>not</strong> force <code class="language-plaintext highlighter-rouge">--attention-backend flashinfer</code> (breaks SM120 hybrid models, vllm#40677; leave attention on <code class="language-plaintext highlighter-rouge">auto</code>, which resolves to FlashInfer anyway). The single most important post-boot check is one grep:</p>

<div class="language-bash highlighter-rouge"><div class="highlight"><pre class="highlight"><code>docker logs qwen36-moe-nvfp4-b12x 2&gt;&amp;1 | <span class="nb">grep</span> <span class="nt">-Ei</span> <span class="s2">"FLASHINFER_B12X|NvFp4 MoE"</span>
<span class="c"># WANT: "Using 'FLASHINFER_B12X' NvFp4 MoE backend"</span>
</code></pre></div></div>

<p>There’s a benign red herring here: a <code class="language-plaintext highlighter-rouge">marlin.py</code> warning that says “GPU does not have native support for FP4.” That’s only the <em>dense</em> linear layers falling back to Marlin; the experts, which are the bulk of the compute, still run on b12x. If you see the b12x line, you’re good; if you don’t, don’t ship it.</p>

<p>With the three env vars and the forced backend, the crash was gone and the model loaded. Then it started lying.</p>

<h2 id="battle-2-the-garbage-output-regression">Battle 2: the garbage-output regression</h2>

<p>The <code class="language-plaintext highlighter-rouge">vllm/vllm-openai:nightly</code> image at the time (build <code class="language-plaintext highlighter-rouge">0.23.1rc1.dev672</code>, dated 2026-07-01) loaded cleanly, engaged b12x, passed its health check, and produced garbage: empty completions, or streams of <code class="language-plaintext highlighter-rouge">&lt;|box_end|&gt;</code> special-token spam. Same checkpoint, same config, incoherent output.</p>

<p>The catch: this only happened under sharding. The reference single-card deployment on a 32 GB RTX 5090 ran the same model fine. Something in the interaction between a recent vLLM change and our multi-GPU split was corrupting the model’s output.</p>

<p>When you have a build that works and a build that doesn’t and a pile of daily images in between, you stop theorizing and start bisecting.</p>

<h2 id="the-bisect">The bisect</h2>

<p>vLLM publishes a nightly image essentially every day. We pulled the run of dailies spanning 2026-06-22 through 2026-07-01, nine builds, and ran the identical sharded NVFP4 config against each, checking a fixed prompt for coherent output (“What is the capital of France?” → must say Paris; a 17×23 arithmetic check; special-token sanity).</p>

<p>The window collapsed fast:</p>

<table>
  <thead>
    <tr>
      <th>Nightly build</th>
      <th>Date</th>
      <th>Commit</th>
      <th>Result</th>
    </tr>
  </thead>
  <tbody>
    <tr>
      <td><code class="language-plaintext highlighter-rouge">dev552</code></td>
      <td>2026-06-29</td>
      <td><code class="language-plaintext highlighter-rouge">4559c43a9</code></td>
      <td>✅ coherent</td>
    </tr>
    <tr>
      <td><code class="language-plaintext highlighter-rouge">dev601</code></td>
      <td>2026-06-30</td>
      <td><code class="language-plaintext highlighter-rouge">a16dbd5b8</code></td>
      <td>❌ garbage</td>
    </tr>
    <tr>
      <td><code class="language-plaintext highlighter-rouge">dev672</code></td>
      <td>2026-07-01</td>
      <td>(<code class="language-plaintext highlighter-rouge">:nightly</code>)</td>
      <td>❌ garbage</td>
    </tr>
  </tbody>
</table>

<p>The regression landed between <code class="language-plaintext highlighter-rouge">dev552</code> and <code class="language-plaintext highlighter-rouge">dev601</code>: <strong>49 commits</strong>. Everything from <code class="language-plaintext highlighter-rouge">dev601</code> onward, including the <code class="language-plaintext highlighter-rouge">:nightly</code> tag everyone pulls by default, was broken for our config.</p>

<h2 id="ruling-out-the-obvious-suspects">Ruling out the obvious suspects</h2>

<p>Forty-nine commits is a lot, and the tempting move is to blame the biggest, scariest change in the range. Two candidates stood out:</p>

<ul>
  <li><strong>The FlashInfer 0.6.13 bump.</strong> Given that all our SM120 pain lives in FlashInfer, a version bump inside the bad window looked like an obvious culprit. We tested around it. It wasn’t the regression.</li>
  <li><strong>A mamba/GDN <code class="language-plaintext highlighter-rouge">align-prefix-cache</code> change.</strong> Qwen3.6 is a hybrid model with mamba-style GDN state; a change touching prefix-cache alignment for exactly those layers is a plausible way to corrupt sharded output. Also not it. Ruled out.</li>
</ul>

<p>We could not pin the regression to a <em>single</em> commit in the window before the practical answer took over: <strong>we don’t need the exact commit, we need a working pin.</strong> <code class="language-plaintext highlighter-rouge">dev552</code> (2026-06-29) is coherent, sharded, and, importantly, <em>newer</em> than the <code class="language-plaintext highlighter-rouge">dev245</code> build the reference 5090 deployment runs. So <code class="language-plaintext highlighter-rouge">dev552</code> became the production pin for NVFP4: the newest build that’s proven-good under our config.</p>

<div class="language-yaml highlighter-rouge"><div class="highlight"><pre class="highlight"><code><span class="na">image</span><span class="pi">:</span> <span class="s">vllm/vllm-openai@sha256:7feb2a09304e3b2d38e224a100316e84fe3205faa7605060609e2c02179cbca6</span>
<span class="c1"># 0.23.1rc1.dev552 — newest nightly confirmed clean under sharded NVFP4/b12x</span>
</code></pre></div></div>

<p>Pinning by digest, not by the <code class="language-plaintext highlighter-rouge">:nightly</code> tag, is the whole lesson. The upstream regression (tracked as #47365) remains unfixed, which means NVFP4 is <em>frozen</em> on this pin: it can’t take newer nightlies until upstream fixes it. That freeze is a real cost, and it’s one of the reasons the <em>other</em> build (AutoRound, which happily rides the latest nightly) stayed in production. More on that trade-off in <a href="/two-5070ti-part3-cpu-vision-sidecar/">Part 3</a>.</p>

<h2 id="the-fp8-kv-detour">The fp8 KV detour</h2>

<p>A smaller battle inside the big one: what dtype to use for the KV cache. NVFP4 is FP4 for the weights, but the KV cache is a separate decision, and the checkpoint is calibrated for fp8 KV. The obvious move on Blackwell is to reach for <code class="language-plaintext highlighter-rouge">nvfp4</code> KV to save even more memory, but that path is hard-gated to SM100/B200 in vLLM and raises a <code class="language-plaintext highlighter-rouge">requires sm100f</code> error on our SM120 consumer cards. It simply doesn’t exist for us.</p>

<p>We briefly suspected fp8 KV itself as the source of the garbage output and tried disabling it, a dead end. The reference 5090 deployment runs fp8 KV correctly with the same b12x backend, which is proof it’s not the bug. So <code class="language-plaintext highlighter-rouge">--kv-cache-dtype=fp8</code> stayed, matching the working reference and the checkpoint’s calibration. The lesson recurs throughout this project: when a known-good reference deployment exists, <em>match it first and change one thing at a time.</em> Most of the “obvious” culprits are things the reference already proves innocent.</p>

<h2 id="cudagraphs-enforce-eager-and-capture-sizing">Cudagraphs, enforce-eager, and capture sizing</h2>

<p>There was also a performance knob we nearly left money on the table over. Early debugging runs used <code class="language-plaintext highlighter-rouge">--enforce-eager</code> to take the compiler and cudagraph capture out of the picture while chasing the garbage-output bug — a reasonable move when you’re isolating a correctness problem. But eager mode is slow, and once the <code class="language-plaintext highlighter-rouge">dev552</code> pin fixed the correctness issue, eager had to go: compilation and cudagraph capture were restored, matching how the reference deployment runs.</p>

<p>Cudagraph capture on SM120 has its own footgun. The reference 5090 deployment sets <code class="language-plaintext highlighter-rouge">--max-cudagraph-capture-size=64</code> to dodge an SM120 cudagraph-replay crash at <em>larger</em> capture sizes. We took a different route: a PIECEWISE capture set explicitly bounded to the sequence sizes we actually run —</p>

<div class="language-yaml highlighter-rouge"><div class="highlight"><pre class="highlight"><code><span class="pi">-</span> <span class="s1">'</span><span class="s">--compilation-config={"cudagraph_mode":"PIECEWISE","cudagraph_capture_sizes":[1,2,4,8]}'</span>
</code></pre></div></div>

<p>Because <code class="language-plaintext highlighter-rouge">max-num-seqs</code> is 8, capturing only sizes <code class="language-plaintext highlighter-rouge">[1,2,4,8]</code> keeps every captured graph far under the size that triggers the replay crash, so the standalone <code class="language-plaintext highlighter-rouge">max-cudagraph-capture-size</code> flag isn’t needed (and would in fact <em>conflict</em> — vLLM requires it to equal the max of the capture sizes). Bounding the capture set to the real concurrency ceiling is both safer and lighter on capture time than a heavy long-context sweep.</p>

<h2 id="the-17-second-freeze">The 17-second freeze</h2>

<p>One more gremlin surfaced repeatedly during benchmarking, and it’s worth documenting because it will fool your measurements. Intermittently, the engine would simply freeze for 8 to 17 seconds mid-serving, then resume as if nothing happened. No error, no OOM.</p>

<p>The trigger is a request-shape transition: a large prefill followed by a small decode-shaped request (or vice versa). Qwen3.6’s GDN linear-attention layers use a CuteDSL kernel that is JIT-compiled per problem shape. When the shape changes sharply, the kernel recompiles — and that recompilation blocks the engine (vllm#47458). On the NVFP4 build the effect was pathological: decode throughput measured <em>cold</em>, right after a big prefill, read ~113 tok/s; the same decode measured <em>warm</em>, after the kernel was cached, read ~171 tok/s.</p>

<p>The practical consequences:</p>

<ol>
  <li><strong>Benchmarks must be warm.</strong> The first small-shape request after big prefills eats the stall. We switched to best-of-N warm timings to get numbers that reflect steady state rather than a compile.</li>
  <li><strong>Decode feels erratic</strong> to a user hitting the server with mixed request sizes, especially on NVFP4. It’s not a throughput problem, it’s a latency spike from a compiler running on the critical path.</li>
</ol>

<p>There’s no clean fix short of pre-warming every shape you expect or an upstream change to cache across shapes. Knowing the <em>cause</em> at least turns a terrifying “the engine randomly hangs” into a bounded, explainable “the GDN kernel is recompiling.”</p>

<h2 id="where-nvfp4-landed">Where NVFP4 landed</h2>

<p>After both battles, NVFP4/b12x runs correctly on the two 5070 Ti cards: native FP4 experts, FP8 attention and KV, coherent output, images working. Its prefill under TP came in a touch <em>faster</em> than the INT4 build’s TP (~7,700 vs ~6,800 tok/s), and it earned a genuine first in this project — working image requests under tensor parallelism — but only after we solved the vision-tower problem in <a href="/two-5070ti-part3-cpu-vision-sidecar/">Part 3</a>.</p>

<p>The catch is everything around the pin: the flaky TP boot from <a href="/two-5070ti-part1-pipeline-vs-tensor-parallel/">Part 1</a>, the frozen <code class="language-plaintext highlighter-rouge">dev552</code> nightly, an undocumented three-variable crash fix, and a thin memory margin. NVFP4 is a <em>validated capability</em>, not the shipped default. Understanding exactly why it stayed on the bench — and how moving the vision encoder to the CPU changed what’s even possible — is <a href="/two-5070ti-part3-cpu-vision-sidecar/">Part 3</a>.</p>

<hr />

<p><em>Next — <a href="/two-5070ti-part3-cpu-vision-sidecar/">Part 3, “Evicting the Vision Encoder to the CPU”</a>: how a FastAPI sidecar freed VRAM, unlocked NVFP4 under tensor parallelism, and taught us why “more KV cache” nearly killed the engine.</em></p>]]></content><author><name>Jim Smith</name></author><category term="AI Technology" /><category term="vllm" /><category term="nvfp4" /><category term="flashinfer" /><category term="blackwell" /><category term="5070ti" /><category term="quantization" /><category term="local-llm" /><category term="moe" /><category term="sm120" /><summary type="html"><![CDATA[Getting Qwen3.6-35B's native NVFP4 build running on two RTX 5070 Tis: an undocumented SM120 crash fix, and bisecting nine vLLM nightlies to find a clean pin.]]></summary></entry><entry><title type="html">What AI Developers Have in Common With Three-Year-Olds on the Boardwalk</title><link href="https://joshua8.ai/two-5070ti-part1-pipeline-vs-tensor-parallel/" rel="alternate" type="text/html" title="What AI Developers Have in Common With Three-Year-Olds on the Boardwalk" /><published>2026-07-03T00:00:00+00:00</published><updated>2026-07-03T00:00:00+00:00</updated><id>https://joshua8.ai/two-5070ti-part1-pipeline-vs-tensor-parallel</id><content type="html" xml:base="https://joshua8.ai/two-5070ti-part1-pipeline-vs-tensor-parallel/"><![CDATA[<p><img src="/images/two-5070ti-part1.png" alt="Two RTX 5070 Tis serving a 35B model — pipeline vs tensor parallelism on consumer Blackwell" /></p>

<p><em>Two 5070 Tis, one 35B model — Part 1 of 3: the parallelism problem (pipeline vs tensor parallel on consumer Blackwell)</em></p>

<h2 id="tldr">TL;DR</h2>

<p>We wanted to serve Qwen3.6-35B-A3B, a 35-billion-parameter mixture-of-experts model, on a desktop with two RTX 5070 Ti cards, 16 GB each. The weights don’t fit on one card, so the model has to be split. The obvious choice, tensor parallelism (TP), turned out to be the wrong one on this hardware: these consumer Blackwell cards have no GPU-to-GPU P2P link, so every layer’s all-reduce crawls over plain PCIe. Pipeline parallelism (PP) splits the model by whole layers, hands off activations only at stage boundaries, and ran prefill <strong>1.9× faster</strong> than TP (~13K vs ~6.8K tok/s). TP won on one axis only (a ~2.5× larger KV cache), but its boot was flaky and its decode was no better. PP became our production split. This post covers <em>why</em> each split behaves the way it does on no-P2P consumer silicon, with the benchmark numbers that settled it.</p>

<hr />

<h2 id="why-run-this-locally-at-all">Why run this locally at all</h2>

<p>Fable 5 shipped, again, and my phone would not stop buzzing. Three developer friends, three separate texts over the course of an afternoon, all some version of the same complaint: <em>out of tokens.</em> Their Claude Max plans had hit the wall on launch day, which is what happens to anything good the moment everyone piles onto it at once.</p>

<p>Then my three-year-old granddaughter walked into the room, planted herself in the doorway, and announced, with total conviction, that <em>she</em> was out of tokens. For a second I thought the outage had achieved sentience. She meant Zelky’s, the arcade down in Rehoboth Beach, where a fistful of tokens buys a fixed amount of whac-a-mole and a few doomed passes at the impossible-to-win stuffed-animal claw, and then, abruptly, does not. Same phrase, same disappointment, entirely different economy. And the only reason she was at the arcade in the first place: her father, the fourth developer of the day, had run out of Claude tokens too, so an afternoon that was supposed to be spent shipping code became an afternoon of whac-a-mole and the claw instead.</p>

<p>The coincidence stuck with me, because a token is a token: a metered unit of something you want more of than you’re given. When the good model ships and everyone shows up, the shared meter runs dry, for a developer on a Max plan and a three-year-old at a claw machine alike. The way out is to own the machine that mints them. Two consumer GPUs and a decent open-weight 35B model, and the meter is yours: no per-request billing, no launch-day rate limit, no afternoon of “out of tokens” texts. The arcade doesn’t run out when you own the arcade.</p>

<p>That’s the motivation. The rest of this series is what it took to get a genuinely useful open-weight model (not frontier-class, but more than good enough for real work) running on hardware you can buy at Walmart. It wasn’t free either; the currency was three weeks of debugging instead of dollars. Here’s how it went.</p>

<h2 id="the-box">The box</h2>

<p>The machine is deliberately unglamorous: two NVIDIA RTX 5070 Ti GPUs, Blackwell architecture, compute capability 12.0 (SM120), 16 GB of VRAM each, hanging off a consumer Intel Core Ultra 9 on a consumer motherboard. Not an H100 with NVLink. Not a workstation board with two full-width slots wired for P2P. This is a gaming desktop pressed into service as an inference server, and its interconnect topology shows it.</p>

<p>Look at how the two cards are actually attached. The board has exactly one PCIe 5.0 x16 slot, and that’s where card 0 lives, with a proper fat pipe to the CPU. There’s nowhere on the board to put a second card at anything like that width. So card 1 is hung off an Oculink cable running PCIe 4.0 x4. Do the arithmetic on that link: PCIe 4.0 x4 is ~8 GB/s in each direction, roughly an eighth of the x16 5.0 slot the other card enjoys, and a rounding error next to the ~450 GB/s of an NVLink bridge. The two GPUs aren’t just missing a fast link between them; the <em>second card’s link to the rest of the machine is a drinking straw.</em></p>

<p>And it gets worse for the thing TP needs most: on this consumer platform the GPUs cannot DMA directly into each other’s memory. There is no P2P path. Anything one card needs from the other doesn’t even get the straw directly. It rides <em>up</em> card 1’s PCIe 4.0 x4 Oculink link to the CPU’s root complex and <em>back down</em> card 0’s link, a full host bounce, on top of the width mismatch.</p>

<p>That combination — no P2P, and an asymmetric x16 / x4 topology — ends up dictating almost every architectural decision in this series. Any strategy that chats constantly between the cards is paying tolls at the slowest link on the board.</p>

<p>The model is Qwen3.6-35B-A3B: 35B total parameters, but a mixture-of-experts design that activates only ~3B per token (the “A3B”). It’s also a <em>hybrid</em> model: it interleaves Gated Delta Net (GDN) linear-attention layers with full-attention layers, which matters enormously later. In INT4 (Intel AutoRound) the weights are ~13.5 GB; in native FP4 (NVFP4) they’re ~22 GB. Either way, one 16 GB card can’t hold the whole thing plus a usable KV cache plus activation scratch. It must be split.</p>

<h2 id="two-ways-to-split-a-model">Two ways to split a model</h2>

<p>There are two standard ways to shard a transformer across GPUs:</p>

<p><strong>Tensor parallelism (TP)</strong> slices <em>every</em> weight matrix across cards: each GPU holds half of every layer’s columns/rows. To compute a single layer you must combine partial results from both cards with an all-reduce. That’s a collective communication on <em>every layer, every forward pass</em>. TP is the darling of datacenter deployments precisely because NVLink makes those all-reduces nearly free.</p>

<p><strong>Pipeline parallelism (PP)</strong> slices the model by <em>depth</em>: card 0 holds the first N layers, card 1 holds the rest. Activations cross the PCIe bus exactly once per micro-batch, at the single stage boundary. No per-layer collective. The cost is “pipeline bubble”: while card 1 works on the back half, card 0 could be idle unless you keep multiple micro-batches in flight.</p>

<p>On NVLink hardware, TP usually wins. The received wisdom is “use TP within a node, PP across nodes.” We are inside a node, so TP should win here too, right?</p>

<p>It didn’t, for three reasons that all trace back to that interconnect.</p>

<h2 id="why-tp-loses-on-no-p2p-consumer-cards">Why TP loses on no-P2P consumer cards</h2>

<p>Three separate failure modes stacked up against TP on this box.</p>

<p><strong>1. The all-reduce tax over a x4 host bounce.</strong> With no P2P, every per-layer all-reduce is a round trip through host memory, and its throughput is gated by the <em>slowest</em> link in the path, which on this board is card 1’s PCIe 4.0 x4 Oculink straw (~8 GB/s). Qwen3.6 has dozens of layers; at TP=2 you pay two of those collectives (one for attention, one for the MLP) <em>per layer, per token batch</em>, each one squeezing through that x4 pipe and bouncing off the CPU. On NVLink that’s tens of microseconds; over an x4 host bounce it’s an order of magnitude worse, and it lands directly on the prefill critical path. This is the dominant reason TP prefill came in at roughly half PP’s throughput. PP, by contrast, crosses that slow link <em>once per micro-batch</em> at the single stage boundary instead of twice per layer. It’s the one strategy that respects the drinking straw.</p>

<p><strong>2. Marlin’s minimum tile width.</strong> The FP4/INT4 dense linear layers fall back to the Marlin GEMM kernel, which has a hard <code class="language-plaintext highlighter-rouge">min_thread_n = 64</code> — the output dimension of a sharded matmul can’t go below 64 columns. TP=2 slices those dense layers in half; several of them drop under Marlin’s floor and the model simply fails to load. PP never slices a matrix — it moves whole layers — so nothing ever falls under the kernel’s minimum. (This bit us specifically on the NVFP4 build, covered in Part 2.)</p>

<p><strong>3. The vision tower gets replicated.</strong> Qwen3.6 is multimodal — it ships a BF16 vision transformer (ViT) for image inputs. Under TP the ViT is <em>replicated on every card</em>, so an image request inflates memory symmetrically on both GPUs and OOMs them together. Under PP the ViT runs on rank 0 only. On 16 GB cards already ~85% full of weights, that replicated ViT is the difference between “images work” and “engine dies.” (<a href="/two-5070ti-part3-cpu-vision-sidecar/">Part 3</a> is entirely about attacking this problem from the other side — evicting the ViT from the GPU altogether.)</p>

<p>None of these three is fatal <em>alone</em>. Together they make TP the wrong default on this hardware.</p>

<h2 id="the-one-thing-tp-is-genuinely-better-at">The one thing TP is genuinely better at</h2>

<p>TP isn’t strictly worse. It has a real, measurable advantage: KV cache capacity.</p>

<p>Because TP shards the weights <em>and</em> the per-layer activation working set across both cards, each GPU carries a lighter fixed load, and the memory the profiler can hand to the paged KV cache roughly doubles. On the GDN hybrid layers, TP also halves the linear-attention state each card must hold. Concretely, at the same context length:</p>

<table>
  <thead>
    <tr>
      <th>Split</th>
      <th style="text-align: right">KV cache pool</th>
      <th style="text-align: right">Relative</th>
      <th style="text-align: right">Prefill throughput</th>
      <th style="text-align: right">Decode</th>
      <th>Boot reliability</th>
    </tr>
  </thead>
  <tbody>
    <tr>
      <td><strong>PP=2</strong></td>
      <td style="text-align: right">196,608 tok</td>
      <td style="text-align: right">1.00×</td>
      <td style="text-align: right"><strong>~12.8–13.5K tok/s</strong></td>
      <td style="text-align: right">baseline</td>
      <td>reliable</td>
    </tr>
    <tr>
      <td><strong>TP=2</strong></td>
      <td style="text-align: right">~503,316 tok</td>
      <td style="text-align: right"><strong>2.56×</strong></td>
      <td style="text-align: right">~6.7–6.8K tok/s</td>
      <td style="text-align: right">≤ PP at every N</td>
      <td><strong>flaky (2/3 boots died)</strong></td>
    </tr>
  </tbody>
</table>

<p>So if your workload is <em>text-only, high-concurrency, very-long-context</em>, the regime where you’re starved for KV pages and don’t care about prefill latency, TP’s 2.5× bigger cache could be the deciding factor. That’s a real niche. It just isn’t <em>our</em> niche.</p>

<h2 id="the-flaky-boot-problem">The flaky-boot problem</h2>

<p>TP had one more strike that doesn’t show up in a throughput table: it wouldn’t boot reliably. Roughly two out of every three cold starts hung silently in NCCL rendezvous — the two ranks never completed their handshake, no error, just a process sitting forever at initialization. A retry loop and <code class="language-plaintext highlighter-rouge">--force-recreate</code> got it up eventually, but “eventually, after two silent hangs” is not a property you want in a service that’s supposed to <code class="language-plaintext highlighter-rouge">restart: unless-stopped</code>. PP boots cleanly, first try, essentially every time.</p>

<p>We never fully root-caused the rendezvous hangs — on a two-GPU single-host setup they’re most likely a shared-memory/IPC timing issue in the collective bootstrap, aggravated by the no-P2P topology. For a production decision it didn’t matter: unreliable boot was disqualifying on its own.</p>

<h2 id="reading-the-throughput-numbers">Reading the throughput numbers</h2>

<p>The prefill gap is worth staring at, because it’s bigger than most people expect. ~13K vs ~6.8K tok/s isn’t a rounding difference — it’s TP paying the PCIe all-reduce tax on a workload that is <em>dominated by prefill</em>. When you feed a long prompt, the model runs one big parallel forward over all prompt tokens; that’s exactly where TP’s per-layer collectives pile up and PP’s single boundary hand-off shines.</p>

<p>Decode (token-by-token generation) is a different story — it’s memory-bandwidth-bound per card and the communication is a smaller fraction of the step, so PP and TP land close. But PP was ≥ TP at every concurrency level we measured, so there was no decode-side reason to prefer TP either.</p>

<p>One measurement caveat that cost us real debugging time: the GDN hybrid layers JIT-compile a CuteDSL kernel that recompiles whenever the request <em>shape</em> changes sharply (a big prefill followed by a small decode). The first small request after a large one can eat an ~8–17 second engine stall, and if you’re not careful you’ll measure that stall as “decode throughput” and get ~113 tok/s when the warm number is ~171. We learned to run best-of-N warm timings. We dig into that stall in Part 2, because on the NVFP4 build it got much worse.</p>

<h2 id="the-kv-cache-paradox-why-16-concurrent-sequences-fit-in-a-pool-that-cant-hold-them">The KV-cache paradox: why 16 concurrent sequences fit in a pool that “can’t hold them”</h2>

<p>There’s a number that looks alarming until you understand vLLM’s scheduler. At 196,608 tokens of context and 16 concurrent sequences, a naive reading says you need 16 × 196,608 ≈ 3.1M tokens of KV cache to guarantee every sequence its full context. Our pool is 196,608 tokens — <em>one</em> sequence’s worth. By that arithmetic the server should fall over the moment two long requests arrive.</p>

<p>It doesn’t, because vLLM’s V1 scheduler is admit-and-queue, not admit-and-preempt. It doesn’t promise every admitted sequence its maximum context up front; it pages KV in as tokens are actually generated, and when the pool gets tight it <em>queues</em> waiting sequences rather than evicting running ones. Under a deliberate 16-way stress test we watched the scheduler settle at ~7 running, 11 waiting, KV at 88.8% utilization, and zero preemptions. The structural preemption trigger (the one that would thrash) turned out to be unreachable for this configuration. Real prompts don’t all demand full context simultaneously; the pool is sized for the <em>working set</em>, not the theoretical worst case.</p>

<p>This matters for the PP-vs-TP decision because it defuses TP’s one advantage. TP’s 2.5× bigger pool sounds decisive only if you believe you need pool ≈ seqs × context. You don’t. Once the scheduler is doing its job, a 196,608-token pool comfortably serves 16 concurrent sequences at long context — so PP’s smaller pool stops being a liability, and its prefill speed and clean boot carry the decision unopposed.</p>

<h2 id="what-prefill-heavy-actually-means-for-the-split">What “prefill-heavy” actually means for the split</h2>

<p>One more piece of context makes the PP choice concrete rather than abstract. Our workload is <em>prefill-heavy</em>: long prompts (documents, long chat histories, images that expand into thousands of vision tokens) relative to the number of tokens generated back. That’s the regime where the forward pass over the prompt dominates wall-clock, and it’s exactly the regime where TP’s per-layer all-reduce tax is most punishing and PP’s single boundary hand-off is cheapest.</p>

<p>If the workload were the opposite — short prompts, long generations, dozens of concurrent streams all starved for KV pages — the calculus would shift toward TP’s bigger pool and away from PP’s prefill edge. We didn’t have that workload. But because we <em>built and validated</em> the TP path anyway (<a href="/two-5070ti-part3-cpu-vision-sidecar/">Part 3</a> shows how), switching is a config change, not a re-architecture, if the traffic ever inverts.</p>

<h2 id="why-this-ordering-of-evidence-matters">Why this ordering of evidence matters</h2>

<p>The takeaway isn’t “PP good, TP bad.” It’s that the right parallelism strategy is a property of your interconnect and your workload, not a universal ranking. On an NVLink DGX, TP=2 for this model would likely win outright. On two consumer cards with no P2P, serving a prefill-heavy multimodal workload, PP wins on throughput, boots reliably, and keeps the vision tower on a single card. TP keeps exactly one trophy, KV capacity, that we didn’t need.</p>

<p>So production runs <strong>PP=2</strong>: 196,608-token context, the vision tower native on rank 0, both cards ~85–92% utilized, clean boots. That’s the split.</p>

<p>But settling PP vs TP was the <em>easy</em> half. The hard half was getting the native-FP4 build to produce correct text at all — which meant bisecting nine days of vLLM nightlies to find the one that didn’t output garbage, and diagnosing an SM120 kernel crash that only exists on consumer Blackwell. That’s Part 2.</p>

<hr />

<p><em>Next — <a href="/two-5070ti-part2-nightly-bisect-nvfp4/">Part 2, “The Nightly From Hell”</a>: bisecting vLLM to find a working NVFP4 build, and the SM120 FP4 crash nobody documents.</em></p>]]></content><author><name>Jim Smith</name></author><category term="AI Technology" /><category term="vllm" /><category term="qwen" /><category term="pipeline-parallel" /><category term="tensor-parallel" /><category term="blackwell" /><category term="5070ti" /><category term="local-llm" /><category term="moe" /><summary type="html"><![CDATA[Two RTX 5070 Tis, one 35B MoE model. Why pipeline parallelism beat tensor parallelism 1.9x on prefill on consumer Blackwell cards with no GPU-to-GPU P2P link.]]></summary></entry><entry><title type="html">200 Billion Parameters for $1,000: Running 4-Bit Quants on eBay Hardware</title><link href="https://joshua8.ai/200b-parameters-1000-ebay-hardware/" rel="alternate" type="text/html" title="200 Billion Parameters for $1,000: Running 4-Bit Quants on eBay Hardware" /><published>2026-06-21T00:00:00+00:00</published><updated>2026-06-21T00:00:00+00:00</updated><id>https://joshua8.ai/200b-parameters-1000-ebay-hardware</id><content type="html" xml:base="https://joshua8.ai/200b-parameters-1000-ebay-hardware/"><![CDATA[<p><img src="/images/200b-ebay-hardware.png" alt="200 billion parameters for $1,000 — running large MoE models on budget eBay hardware" /></p>

<p><em>Follow-up: <a href="/1000-box-one-month-mtp-model-zoo/">The $1,000 Box, One Month On: A Model Zoo and Multi-Token Prediction</a> — the same box now serves 44 models, and multi-token prediction lifted the flagship 122B decode 52%.</em></p>

<p><strong>TL;DR</strong>
You can run frontier-size mixture-of-experts (MoE) models—such as Qwen3.5-122B, MiniMax-M2.7 (~229B), and DeepSeek-V4-Flash (284B)—on a modest GPU backed by standard system RAM using <code class="language-plaintext highlighter-rouge">llama.cpp</code>’s <code class="language-plaintext highlighter-rouge">--cpu-moe</code> flag. This works because these models only activate a fraction of their parameters per token (around 10–13B), allowing the massive “expert” weights to live in cheap system RAM while the GPU handles attention and the KV cache.</p>

<p>While a $12.5K RTX PRO 6000 setup runs Qwen3.5-122B at a blistering 128 tokens per second (tok/s) for a single user—and an aggregate 780 tok/s for a concurrency of 8 users—a $1,000 eBay-scavenged Xeon workstation with 2016-era Pascal cards runs the same model at ~10 tok/s. It’s slower, yes, but still faster than most people read—and entirely usable for a single person. You sacrifice raw concurrency, not capability.</p>

<hr />

<p>The prevailing advice for running massive MoE models locally usually demands a massive budget: drop $25,000 on two RTX PRO 6000 Blackwells, buy two DGX Sparks (which run about $4,699 each), or pick up two Strix Halos with 128GB of unified memory (priced around $3,999 each). The logic assumes that because 4-bit model weights take up 70–160GB, you need a matching mountain of ultra-fast VRAM.</p>

<p>You don’t.</p>

<p>Over the past two weeks, I’ve been running Qwen3.5-122B-A10B, MiniMax-M2.7 (~229B), and DeepSeek-V4-Flash (284B) on setups that look nothing like a datacenter. One is a machine with a single RTX 5090, and the other is a ~$1,000 workstation built from eBay parts featuring a pair of $250 Quadro P5000s from 2016. The secret lies in a <code class="language-plaintext highlighter-rouge">llama.cpp</code> feature called <code class="language-plaintext highlighter-rouge">--cpu-moe</code>, which exploits a massive architectural asymmetry that standard hardware advice ignores.</p>

<h2 id="the-fact-that-changes-the-math">The Fact That Changes the Math</h2>

<p>Running a dense 122B model on a CPU would be agonizing. Every generated token requires touching all 122 billion parameters. Because CPU memory bandwidth (a few hundred GB/s on DDR4/DDR5) is an order of magnitude slower than a GPU, you would wait seconds for a single token.</p>

<p>But new MoE models aren’t dense. Consider the active parameters:</p>

<ul>
  <li><strong>Qwen3.5-122B-A10B:</strong> 122B total, 10B active per token.</li>
  <li><strong>MiniMax-M2.7:</strong> 229B total, ~10B active per token.</li>
  <li><strong>DeepSeek-V4-Flash:</strong> 284B total, 13B active per token.</li>
</ul>

<p>This asymmetry changes everything. The bulk of the weights—tens of gigabytes of “experts”—sit idle for any given token. Using the <code class="language-plaintext highlighter-rouge">--cpu-moe</code> (or <code class="language-plaintext highlighter-rouge">-cmoe</code>) flag stores these mostly dormant experts in affordable system RAM. Only the components that touch <em>every</em> token—the attention layers, dense projections, and KV cache—remain on the GPU.</p>

<p>The result is a clean division of labor: the modest GPU handles the compute-intensive attention math, while cheap system RAM holds the massive pile of sleeping experts.</p>

<h2 id="the-two-budget-boxes">The Two Budget Boxes</h2>

<ul>
  <li><strong>The Ryzen Box:</strong> A more conventional build pairing an RTX 5090 (32GB, Blackwell) with an AMD Ryzen 9 9950X (16 cores / 32 threads) and 192GB of DDR5 RAM. The total build costs about $5,000, which includes the ~$3,200 GPU.</li>
  <li><strong>The Xeon Box:</strong> Built purely from older eBay parts, featuring dual Intel Xeon E5-2698 v4 CPUs (2016 Broadwell, 40 physical cores total), 128GB of DDR4 RAM, and two Quadro P5000s (16GB VRAM each). The GPUs were $250 each, the CPUs were $100 for the pair, and the chassis/board/RAM cost $425. Total cost: ~$1,000 for 32GB of aggregate VRAM and enough system memory to host a 108GB model.</li>
</ul>

<p><em>(Note: These prices are roughly a year old, sourced before recent DRAM spikes. Replicating the $1,000 box today might cost closer to $1,400–$1,800 due to memory pricing.)</em></p>

<h2 id="the-performance-numbers">The Performance Numbers</h2>

<p>Here is the single-stream decode throughput for Qwen3.5-122B-A10B, comparing our budget boxes against a “money-no-object” $12.5K RTX PRO 6000 reference machine:</p>

<table>
  <thead>
    <tr>
      <th>Machine</th>
      <th>GPU(s)</th>
      <th>Total Box Cost</th>
      <th>Decode Speed</th>
    </tr>
  </thead>
  <tbody>
    <tr>
      <td>RTX PRO 6000</td>
      <td>1× Blackwell 96GB</td>
      <td>~$12.5K</td>
      <td>128 tok/s</td>
    </tr>
    <tr>
      <td>Ryzen Box</td>
      <td>1× RTX 5090 32GB</td>
      <td>~$5,000</td>
      <td>22.8 tok/s</td>
    </tr>
    <tr>
      <td>Xeon Box</td>
      <td>2× Pascal P5000 16GB</td>
      <td>~$1,000</td>
      <td>~10 tok/s</td>
    </tr>
  </tbody>
</table>

<p>The $12.5K setup (a $10K card and a $2.5K box) is instantly responsive because it holds all 73GB of quantized weights in VRAM. But a $1,000 box with nine-year-old GPUs running a 122-billion-parameter model at 10 tokens per second is highly usable for interactive chat or coding assistance.</p>

<p>The Ryzen box is roughly twice as fast as the Xeon for two reasons—and the first one is easy to get backwards. With <code class="language-plaintext highlighter-rouge">--cpu-moe</code>, the experts that dominate decode are streamed from <em>system</em> RAM, not from the GPU. The Ryzen’s DDR5 is considerably faster than the Xeon’s 2016-era DDR4, so the host memory feeding those experts is the real difference. (The 5090’s own GDDR7 VRAM is faster still, but the offloaded experts never live there—only the attention layers and KV cache do.) Second, the modern 5090 chews through the attention math far quicker than a pair of Pascal P5000s.</p>

<h2 id="the-trade-offs-of-cpu-offloading">The Trade-offs of CPU Offloading</h2>

<p>This approach isn’t free. Here are the very real bottlenecks:</p>

<ul>
  <li><strong>Decode is CPU-bandwidth-bound:</strong> The speed limit (10–23 tok/s) is dictated by how fast your RAM feeds the active experts to the CPU cores. Relying on hyperthreading can actually hurt performance; sticking to physical cores yields better results.</li>
  <li><strong>Prefill is compute-bound and agonizingly slow:</strong> Digesting a long prompt requires raw FLOPS and TOPS, which old CPUs severely lack.</li>
  <li><strong>Context is surprisingly cheap:</strong> Because the massive experts live in RAM, your GPU effortlessly handles the KV cache. The RTX 5090 fits Qwen3.5-122B’s entire 256K context into just 12GB of VRAM.</li>
  <li><strong>You must pin the experts in RAM:</strong> Using <code class="language-plaintext highlighter-rouge">--no-mmap</code> and <code class="language-plaintext highlighter-rouge">--mlock</code> together prevents the kernel from paging files out to swap memory mid-generation.</li>
</ul>

<h2 id="the-asymmetry-prefill-vs-generation">The Asymmetry: Prefill vs. Generation</h2>

<p>An LLM request has two phases with entirely different bottlenecks. <strong>Generation</strong> is memory-bandwidth-bound, but <strong>prefill</strong> (digesting the prompt) is compute-bound.</p>

<p>While the dual Xeon’s 150 GB/s memory bandwidth is about 10% of the RTX PRO 6000’s 1.8 TB/s, the compute gap is astronomical. The Blackwell card delivers 125 TFLOPS of FP32 and 4,000 AI TOPS via tensor cores, whereas the 2016 Xeons manage only ~2.8 TFLOPS of FP32 with zero tensor cores.</p>

<p>The rule of thumb: decode speed barely moves with prompt length, but prefill cost explodes. A 44.5K token prefill for DeepSeek-V4-Flash took roughly 10 minutes on the Ryzen box. Extrapolating a 256K-token prompt implies waiting over an hour just for the first token. <strong>Pick your hardware by your expected prompt length, not just your model size.</strong></p>

<h2 id="concurrency-what-the-125k-box-actually-buys">Concurrency: What the $12.5K Box Actually Buys</h2>

<p>When serving Qwen3.5-122B via vLLM on the RTX PRO 6000, a single user gets 128 tok/s, but pushing a concurrency of 8 users yields a massive 780 tok/s aggregate throughput.</p>

<p>CPU-offloading cannot match this. On the 5090, pushing multiple requests causes aggregate throughput to rise sub-linearly, while the per-request rate collapses from 23 tok/s to roughly 8.5 tok/s as the CPU experts saturate. If you need to serve a team, buy the big card.</p>

<h2 id="important-caveats--setup">Important Caveats &amp; Setup</h2>

<ul>
  <li><strong>Old GPUs mean old CUDA:</strong> The P5000s are Pascal architecture, meaning they are pinned to a CUDA-12.8 <code class="language-plaintext highlighter-rouge">llama.cpp</code> image since CUDA 13 dropped Pascal support.</li>
  <li><strong>DeepSeek-V4-Flash:</strong> This architecture requires a community fork to run properly, so verified numbers are only available for the Ryzen box (hitting 11–12 tok/s).</li>
  <li><strong>Heat and Power Draw:</strong> Old servers are power hungry. The small server room holding the boxes for these tests rose to 83°F when I started running these evals—just a bit too warm for the office. Expect about 800W of power draw on the dual Xeons, and pushing 1000W+ on the RTX 5090 setup.</li>
</ul>

<p><strong>The Flags You Need</strong>:</p>

<ul>
  <li><code class="language-plaintext highlighter-rouge">--cpu-moe</code> (or <code class="language-plaintext highlighter-rouge">--n-cpu-moe N</code> to shift layers manually).</li>
  <li><code class="language-plaintext highlighter-rouge">--no-mmap</code> and <code class="language-plaintext highlighter-rouge">--mlock</code> to pin weights in anonymous RAM. On the Ryzen box, MiniMax’s 131GB pins cleanly into the 192GB of RAM; on the Xeon, an IQ4_XS quant’s ~108GB pin leaves about ~20GB free on the 128GB box.</li>
  <li><code class="language-plaintext highlighter-rouge">--flash-attn on</code> alongside a quantized KV cache (like <code class="language-plaintext highlighter-rouge">q8_0</code>) to save VRAM.</li>
  <li><code class="language-plaintext highlighter-rouge">--threads</code> set strictly to physical cores (plus <code class="language-plaintext highlighter-rouge">--numa distribute</code> for dual-socket setups).</li>
  <li><code class="language-plaintext highlighter-rouge">--parallel 1</code> to dedicate the entire context window to a single user.</li>
</ul>

<h2 id="conclusion">Conclusion</h2>

<p>This was never about speed; it’s about access. You are giving up the headroom for concurrency and the instant first token. But you are gaining the ability to run 122-billion, 229-billion, or 284-billion-parameter models on hardware that costs as much as a used laptop.</p>]]></content><author><name>Jim Smith</name></author><category term="AI Technology" /><category term="llama-cpp" /><category term="qwen" /><category term="minimax" /><category term="deepseek" /><category term="moe" /><category term="cpu-offload" /><category term="local-llm" /><category term="pascal" /><category term="rtx-5090" /><category term="budget" /><summary type="html"><![CDATA[How I run Qwen3.5-122B, MiniMax-M2.7, and DeepSeek-V4-Flash on a modest GPU (15-32GB VRAM) plus cheap CPU RAM using llama.cpp's --cpu-moe expert offload. Benchmarks from an RTX 5090 box and a $1,000 eBay Xeon.]]></summary></entry><entry><title type="html">Revisiting LegalBench: New Models, A Bug I Missed, and a New Leader</title><link href="https://joshua8.ai/legalbench-revisited-new-models-bug-fix/" rel="alternate" type="text/html" title="Revisiting LegalBench: New Models, A Bug I Missed, and a New Leader" /><published>2026-04-17T00:00:00+00:00</published><updated>2026-04-17T00:00:00+00:00</updated><id>https://joshua8.ai/legalbench-revisited-new-models-bug-fix</id><content type="html" xml:base="https://joshua8.ai/legalbench-revisited-new-models-bug-fix/"><![CDATA[<p><img src="/images/legalbench-revisited.png" alt="LegalBench revisited — new models, bug fix, and a new leader" /></p>

<p>Last month I published <a href="/legalbench-smaller-ai-beats-bigger-at-law/">benchmark results</a> comparing five LLMs on LegalBench, a suite of 161 legal reasoning tasks. The 27B Qwen3.5 model won at 0.7936, beating a 120B reasoning model by 6 points. The headline was that bigger isn’t better for legal work.</p>

<p>Since then, two things happened. First, I added two more models to the lineup: Qwen3.6-35B (which dropped yesterday) and Qwen3.5-122B (which I simply didn’t evaluate in round one). Second, I found a bug in my benchmarking code that was quietly suppressing scores on one category of tasks. Fixing it changes the leaderboard.</p>

<h2 id="the-additional-models">The Additional Models</h2>

<p>Both are MoE architectures from the Qwen team:</p>

<table>
  <thead>
    <tr>
      <th>Model</th>
      <th>Total params</th>
      <th>Active params</th>
      <th>Quantization</th>
    </tr>
  </thead>
  <tbody>
    <tr>
      <td>Qwen3.6-35B</td>
      <td>35B</td>
      <td>~3B (A3B)</td>
      <td>AWQ 4-bit</td>
    </tr>
    <tr>
      <td>Qwen3.5-122B</td>
      <td>122B</td>
      <td>~10B (A10B)</td>
      <td>AWQ 4-bit</td>
    </tr>
  </tbody>
</table>

<p>Both AWQ 4-bit quantizations were produced by <a href="https://huggingface.co/cyankiwi">cyankiwi</a>. The 3.6-35B ran on my RTX 5090; the 122B ran on an RTX 6000 Pro. Both served via vLLM in no-think mode, same prompts as the original benchmark.</p>

<h2 id="the-bug-i-missed">The Bug I Missed</h2>

<p>When I pulled the raw outputs for the MAUD category — 34 tasks on M&amp;A agreement interpretation that use A/B/C/D/E multiple-choice — I noticed something weird. Qwen3.6-35B had scored <strong>0.012</strong> on <code class="language-plaintext highlighter-rouge">maud_fiduciary_exception_board_determination_trigger_(no_shop)</code>. That’s below random chance for a binary question.</p>

<p>A look at the generations explained it: the model was answering <code class="language-plaintext highlighter-rouge">"Option B"</code> while the gold label was <code class="language-plaintext highlighter-rouge">"B"</code>. My <code class="language-plaintext highlighter-rouge">extract_answer()</code> function was returning the full string <code class="language-plaintext highlighter-rouge">"Option B"</code>, which never matched <code class="language-plaintext highlighter-rouge">"B"</code> in the grader.</p>

<p>Worse, on some tasks the model answered <code class="language-plaintext highlighter-rouge">"Yes"</code> when the question was A/B multiple choice. The “disproportionate impact modifier” prompts read like yes/no questions, and the model took the bait.</p>

<p>This was present in every model’s results to varying degrees:</p>

<table>
  <thead>
    <tr>
      <th>Model</th>
      <th>MAUD tasks affected</th>
    </tr>
  </thead>
  <tbody>
    <tr>
      <td>Nemotron-30B</td>
      <td>15</td>
    </tr>
    <tr>
      <td>Qwen3.6-35B</td>
      <td>20</td>
    </tr>
    <tr>
      <td>Qwen3.5-35B</td>
      <td>6</td>
    </tr>
    <tr>
      <td>gpt-oss-120b</td>
      <td>4</td>
    </tr>
    <tr>
      <td>Qwen3.5-27B</td>
      <td>4</td>
    </tr>
    <tr>
      <td>Qwen3.5-9B</td>
      <td>2</td>
    </tr>
    <tr>
      <td>Qwen3.5-122B</td>
      <td>0</td>
    </tr>
  </tbody>
</table>

<p>The 122B got clean letters on everything — the issue was specific to how smaller models handled the MAUD prompt format. Still, a benchmark bug is a benchmark bug.</p>

<h2 id="the-fix">The Fix</h2>

<p>Two changes to <code class="language-plaintext highlighter-rouge">run_legalbench.py</code>:</p>

<ol>
  <li><strong>Output extraction</strong> — added a regex to strip <code class="language-plaintext highlighter-rouge">"Option X"</code> prefix: <code class="language-plaintext highlighter-rouge">^Option\s+([A-Z])\b → \1</code></li>
  <li><strong>System prompt</strong> — added an explicit instruction: “If the question offers lettered answer choices (A, B, C, …), reply with ONLY the letter — never ‘Yes’ or ‘No’, never ‘Option X’, just the letter.”</li>
</ol>

<p>I re-ran the 20 problematic MAUD tasks for Qwen3.6-35B with both fixes in place. The results were dramatic:</p>

<table>
  <thead>
    <tr>
      <th>Task</th>
      <th>Before</th>
      <th>After</th>
      <th>Delta</th>
    </tr>
  </thead>
  <tbody>
    <tr>
      <td>fiduciary_exception_board_determination_trigger</td>
      <td>0.012</td>
      <td>0.964</td>
      <td><strong>+0.952</strong></td>
    </tr>
    <tr>
      <td>specific_performance</td>
      <td>0.317</td>
      <td>0.994</td>
      <td>+0.677</td>
    </tr>
    <tr>
      <td>pandemic_or_other_public_health_event (disproportionate)</td>
      <td>0.025</td>
      <td>0.650</td>
      <td>+0.625</td>
    </tr>
    <tr>
      <td>ordinary_course_efforts_standard</td>
      <td>0.325</td>
      <td>0.933</td>
      <td>+0.608</td>
    </tr>
    <tr>
      <td>cor_standard_(intervening_event)</td>
      <td>0.183</td>
      <td>0.762</td>
      <td>+0.579</td>
    </tr>
    <tr>
      <td>general_economic_and_financial_conditions</td>
      <td>0.006</td>
      <td>0.524</td>
      <td>+0.518</td>
    </tr>
    <tr>
      <td>(15 others)</td>
      <td>…</td>
      <td>…</td>
      <td>+0.12 to +0.45</td>
    </tr>
  </tbody>
</table>

<p>Every one of the 20 tasks improved. No regressions. Qwen3.6-35B’s overall score went from <strong>0.7483 to 0.7982</strong> — a +5.0 point jump from an extraction fix alone.</p>

<p>I didn’t re-run the fix on the other models. Their rankings in the original post stand, but be aware that Nemotron and the older 35B are underreported. If I re-ran Nemotron with the fix, I’d expect it to gain 5-8 points and climb out of last place.</p>

<h2 id="updated-leaderboard">Updated Leaderboard</h2>

<table>
  <thead>
    <tr>
      <th>Rank</th>
      <th>Model</th>
      <th>Score</th>
      <th>Notes</th>
    </tr>
  </thead>
  <tbody>
    <tr>
      <td>1</td>
      <td><strong>Qwen3.5-122B</strong></td>
      <td><strong>0.7990</strong></td>
      <td>MoE, 10B active</td>
    </tr>
    <tr>
      <td>2</td>
      <td>Qwen3.6-35B</td>
      <td>0.7982</td>
      <td>MoE, 3B active — after MAUD fix</td>
    </tr>
    <tr>
      <td>3</td>
      <td>Qwen3.5-27B</td>
      <td>0.7936</td>
      <td>Dense</td>
    </tr>
    <tr>
      <td>4</td>
      <td>Qwen3.5-35B</td>
      <td>0.7612</td>
      <td>MoE, 3B active</td>
    </tr>
    <tr>
      <td>5</td>
      <td>Qwen3.5-9B</td>
      <td>0.7583</td>
      <td>Dense</td>
    </tr>
    <tr>
      <td>6</td>
      <td>gpt-oss-120b</td>
      <td>0.7313</td>
      <td>Reasoning model</td>
    </tr>
    <tr>
      <td>7</td>
      <td>Nemotron-30B</td>
      <td>0.5509</td>
      <td>MoE (would gain ~5-8 pts with fix)</td>
    </tr>
  </tbody>
</table>

<p>The top three models are separated by less than one point. The 122B edges out the 3.6-35B by 0.0008 — statistical noise.</p>

<h2 id="what-the-122b-buys-you">What the 122B Buys You</h2>

<p>The 122B has 3.5x more total parameters than the 3.6-35B and runs with 3.3x more active parameters per token. For a one-point gain over the 3.6-35B, is it worth it?</p>

<p>Looking at head-to-head on the 34 MAUD tasks (where the 122B should theoretically benefit most from its extra capacity):</p>

<table>
  <thead>
    <tr>
      <th> </th>
      <th>Score</th>
      <th>Task wins</th>
    </tr>
  </thead>
  <tbody>
    <tr>
      <td>Qwen3.6-35B (post-fix)</td>
      <td>0.626</td>
      <td>17</td>
    </tr>
    <tr>
      <td>Qwen3.5-122B</td>
      <td>0.618</td>
      <td>15 (+ 2 ties)</td>
    </tr>
  </tbody>
</table>

<p>Essentially a tie. The 122B wins on tasks that require memorized legal domain knowledge (<code class="language-plaintext highlighter-rouge">accuracy_of_target_capitalization_rw</code>: 0.755 vs 0.399). The 3.6-35B wins where the MAUD fix saved it (<code class="language-plaintext highlighter-rouge">fiduciary_exception_board_determination_trigger</code>: 0.964 vs 0.494).</p>

<p>Outside MAUD, both models perform similarly on contract NLI, CUAD clause detection, and privacy policy tasks — in the 0.90s range for most of them.</p>

<p><strong>Verdict:</strong> The 122B gives you minimal gains — like the 3rd decimal point. It takes up ~3x the memory and runs at about half the speed. The real “gain” was that it followed instructions and answered without the word “Option” prefix. A better system prompt fixed that on the 3.6-35B. So the original verdict stands: moving from smaller models that fit on consumer GPU cards like the 5090 to workstation-class models did not offer a noticeable improvement on this benchmark.</p>

<h2 id="qwen36-35b-vs-qwen35-35b">Qwen3.6-35B vs Qwen3.5-35B</h2>

<p>The most interesting comparison is between the two 35B MoE models. Same parameter count, same active params, same quantization. Just a generation apart:</p>

<table>
  <thead>
    <tr>
      <th> </th>
      <th>Qwen3.5-35B</th>
      <th>Qwen3.6-35B (post-fix)</th>
    </tr>
  </thead>
  <tbody>
    <tr>
      <td>Overall</td>
      <td>0.7612</td>
      <td>0.7982</td>
    </tr>
    <tr>
      <td>Gain</td>
      <td>—</td>
      <td><strong>+3.7 points</strong></td>
    </tr>
  </tbody>
</table>

<p>A clean 3.7-point improvement at fixed parameter count. That’s the “raw model quality” delta between 3.5 and 3.6 — separate from any quantization or architectural choice.</p>

<h2 id="does-the-original-blogs-conclusion-still-hold">Does the Original Blog’s Conclusion Still Hold?</h2>

<p>The original post argued that smaller, well-quantized local models can beat a 120B reasoning model on legal work. That conclusion is stronger now, not weaker:</p>

<ul>
  <li>The 27B Qwen3.5 (dense, 16GB VRAM) still beats gpt-oss-120b by 6 points.</li>
  <li>The 3.6-35B (MoE, 20GB VRAM) beats gpt-oss-120b by 7 points.</li>
  <li>Even the 9B (single GPU) beats gpt-oss-120b by 3 points.</li>
</ul>

<p>The 122B scoring 0.7990 is notable — it’s the first local model to cross 0.79 — but it’s not enough to change the fundamental story. Parameter count continues to be a bad predictor of legal reasoning ability relative to model generation and training data.</p>

<p>And the MAUD bug is a reminder: benchmarks measure your whole pipeline, not just the model. A small string in an extraction function can cost 5 points.</p>

<h2 id="whats-next">What’s Next</h2>

<p>The most interesting finding here is the generational jump from Qwen3.5-35B to Qwen3.6-35B: +3.7 points at fixed parameter count, active parameter count, and quantization. That’s a clean measurement of how much the 3.5 → 3.6 update is worth on legal reasoning.</p>

<p>And Qwen3.6-35B dropped <em>yesterday</em>. There’s no 3.6-122B yet, only the 3.5-122B I tested here. If the same 3.7-point generational improvement carries over to the larger MoE, the eventual Qwen3.6-122B could push past 0.83 on this benchmark. I’ll re-run as soon as it’s released.</p>

<p>Zooming out: on this legal benchmark, local Qwen models are consistently strong against other local open-weight options. The 27B, 9B, 35B, new 3.6-35B, and 122B all outperform gpt-oss-120b. That’s not a knock on OpenAI’s open-weight model — it’s a real legal benchmark, and these Qwen models are very good at it.</p>]]></content><author><name>Jim Smith</name></author><category term="AI Technology" /><category term="legalbench" /><category term="local-llm" /><category term="qwen" /><category term="benchmark" /><category term="legal-ai" /><category term="quantization" /><summary type="html"><![CDATA[Adding Qwen3.6-35B and Qwen3.5-122B to the LegalBench lineup — plus fixing an extraction bug that was quietly suppressing scores on 34 MAUD tasks.]]></summary></entry><entry><title type="html">Chasing an 8% Decode Regression in vLLM Nightlies on Desktop Blackwell</title><link href="https://joshua8.ai/vllm-nightly-decode-regression-qwen35/" rel="alternate" type="text/html" title="Chasing an 8% Decode Regression in vLLM Nightlies on Desktop Blackwell" /><published>2026-04-13T00:00:00+00:00</published><updated>2026-04-13T00:00:00+00:00</updated><id>https://joshua8.ai/vllm-nightly-decode-regression-qwen35</id><content type="html" xml:base="https://joshua8.ai/vllm-nightly-decode-regression-qwen35/"><![CDATA[<p><img src="/images/vllm-nightly-decode-regression.png" alt="Illustration of an 8% loss in vLLM decode performance on Blackwell GPUs" /></p>

<p><em>Note: “We” throughout this post refers to Jim Smith working alongside Claude Code.</em></p>

<p>This morning my 87-year-old mother texted me that TJ Maxx had tried to charge her 6% sales tax on a clothing purchase in Pennsylvania. Clothing isn’t taxed in PA. She caught it at the register and saved herself the 6%. A few hours later, sitting in front of some vLLM benchmarks, I caught something that rhymed: an 8% loss in token generation speed that everyone on the moving nightly tag has been quietly paying. Same instinct, different register tape.</p>

<h2 id="tldr">TL;DR</h2>

<p>We noticed our Qwen3.5-35B-A3B serving container on an RTX PRO 6000 Blackwell Max-Q was decoding at 183 tok/s while a sibling container on an RTX 5090 hit 225 tok/s. We chalked it up to the 5090’s higher memory bandwidth — until a controlled test exposed the real story: the regression wasn’t the GPU, it was the vLLM nightly image. Running the exact same configuration on the PRO 6000 with a pinned mar23 nightly bumped decode from 183 → 198.6 tok/s, an 8% jump from changing only the image tag.</p>

<p>We bisected through 315 vLLM commits between the two image builds, narrowed to three suspects, and found the culprit: PR #38152, an 8-line revert of dual-stream execution for Qwen3 and Qwen3.5 input projections. The PR is unusually candid — it deliberately gave back hot-path decode throughput to fix a 4x cold-compile-time regression, with a TODO to re-enable once PyTorch 2.11 and #38123 land.</p>

<p>Three options if you’re hit by this: pin the older image, overlay the file to restore the parallel-stream branch, or wait for the proper fix. This post walks through the bisection and the tradeoff.</p>

<hr />

<h2 id="the-setup">The setup</h2>

<p>We run two vLLM containers side by side on a workstation with two Blackwell GPUs: an RTX PRO 6000 Blackwell Max-Q (97 GB, SM 12.0) and an RTX 5090 (32 GB, same SM). Both serve the same 35B-parameter hybrid MoE model, <code class="language-plaintext highlighter-rouge">cyankiwi/Qwen3.5-35B-A3B-AWQ-4bit</code>, through the <code class="language-plaintext highlighter-rouge">vllm/vllm-openai:cu130-nightly</code> image. One container stays pinned to a known-good digest; the other rides the moving nightly tag so we can test patches against the latest Triton, FlashInfer, and vLLM changes.</p>

<p>The pinned sibling on the 5090 has been humming along at around 225 tokens per second of single-stream decode. The latest-nightly container on the PRO 6000 was posting 183 tok/s. We had been telling ourselves this was just the 5090’s higher memory bandwidth showing up — decode is memory-bound, and the 5090’s ~1.8 TB/s beats the PRO 6000 Max-Q’s ~1.6 TB/s. A ~13% gap felt about right.</p>

<p>It wasn’t right. The difference wasn’t the GPU. It was the nightly.</p>

<h2 id="the-apples-to-apples-test">The apples-to-apples test</h2>

<p>The trick was to break the comparison into two steps.</p>

<p><strong>Step 1: move the sibling’s exact configuration to the PRO 6000.</strong> We copied the sibling’s docker-compose verbatim, changed nothing except <code class="language-plaintext highlighter-rouge">CUDA_VISIBLE_DEVICES=0</code> and the port, and pointed the mount at the same pinned digest (<code class="language-plaintext highlighter-rouge">vllm/vllm-openai@sha256:923cbdaf...</code>, which maps to <code class="language-plaintext highlighter-rouge">cu130-nightly-mar23</code>). Single-stream decode on the PRO 6000 jumped from 183 to <strong>198.6 tok/s</strong>. That closed most of the gap to the 5090’s 225 tok/s, which is now just the memory-bandwidth story we had originally told ourselves, at a believable ~12%.</p>

<p><strong>Step 2: change only the image, not the configuration.</strong> Same container, same GPU, same PR #37700 chunk_o overlay, same <code class="language-plaintext highlighter-rouge">--gpu-memory-utilization 0.5</code>, same <code class="language-plaintext highlighter-rouge">--max-num-seqs 8</code>. Only the image tag changed: mar23 → latest cu130-nightly.</p>

<table>
  <thead>
    <tr>
      <th>Image</th>
      <th>Single</th>
      <th>Par 2</th>
      <th>Par 4</th>
      <th>Par 8</th>
    </tr>
  </thead>
  <tbody>
    <tr>
      <td>cu130-nightly-mar23</td>
      <td><strong>198.3</strong></td>
      <td>342.3</td>
      <td>653.9</td>
      <td><strong>1119.1</strong></td>
    </tr>
    <tr>
      <td>cu130-nightly (current)</td>
      <td>183.5</td>
      <td>298.7</td>
      <td>582.0</td>
      <td>1030.8</td>
    </tr>
  </tbody>
</table>

<p>Roughly 8% slower on single-stream decode, widening at higher concurrency. Not a config artifact. Not a hardware story. The nightly got slower.</p>

<h2 id="narrowing-the-window">Narrowing the window</h2>

<p>Image versions revealed two vLLM commits at the endpoints:</p>

<ul>
  <li>mar23: <code class="language-plaintext highlighter-rouge">vllm 0.18.1rc1.dev32+g1f0d21064</code></li>
  <li>current: <code class="language-plaintext highlighter-rouge">vllm 0.18.2rc1.dev54+g73f48ce55</code></li>
</ul>

<p>Torch and Triton were identical (2.10.0+cu130 and 3.6.0 respectively). FlashInfer moved 0.6.6 → 0.6.7, but its kernels are not on the GDN decode path for this model. Between those two vLLM commits: 315 changes.</p>

<p>We filtered <code class="language-plaintext highlighter-rouge">git log</code> down to paths that actually touch the Qwen3.5-35B-A3B-AWQ decode hot loop — fused MoE, FLA kernels, the Qwen3.5/Qwen3-Next model files, the GPU model runner, and the sampler. That dropped the candidate list to roughly 80 commits. Three stood out immediately:</p>

<ul>
  <li><code class="language-plaintext highlighter-rouge">a8eab8f30</code> “Extract GatedDeltaNetAttention into shared layer for Qwen3Next and Qwen3.5” — a 2,000-line refactor.</li>
  <li><code class="language-plaintext highlighter-rouge">b779eb336</code> “Sync upstream BT=chunk_size fix for GDN chunk_fwd_kernel_o, simplify warmup to single pass” — touches the exact kernel we’d been trying to tune.</li>
  <li><code class="language-plaintext highlighter-rouge">9704a5c31</code> “Disable dual stream execution of input projection for Qwen3.”</li>
</ul>

<p>The last one was an 8-line diff in <code class="language-plaintext highlighter-rouge">vllm/model_executor/models/qwen3_5.py</code>. That was the culprit.</p>

<h2 id="the-culprit-pr-38152">The culprit: PR #38152</h2>

<p>Before the change, the GDN block’s input projection looked like this:</p>

<div class="language-python highlighter-rouge"><div class="highlight"><pre class="highlight"><code><span class="n">mixed_qkvz</span><span class="p">,</span> <span class="n">ba</span> <span class="o">=</span> <span class="n">torch</span><span class="p">.</span><span class="n">ops</span><span class="p">.</span><span class="n">vllm</span><span class="p">.</span><span class="nf">gdn_in_proj</span><span class="p">(</span>
    <span class="n">hidden_states</span><span class="p">,</span>
    <span class="nf">sum</span><span class="p">(</span><span class="n">self</span><span class="p">.</span><span class="n">in_proj_qkvz</span><span class="p">.</span><span class="n">output_sizes</span><span class="p">)</span> <span class="o">//</span> <span class="n">self</span><span class="p">.</span><span class="n">tp_size</span><span class="p">,</span>
    <span class="nf">sum</span><span class="p">(</span><span class="n">self</span><span class="p">.</span><span class="n">in_proj_ba</span><span class="p">.</span><span class="n">output_sizes</span><span class="p">)</span> <span class="o">//</span> <span class="n">self</span><span class="p">.</span><span class="n">tp_size</span><span class="p">,</span>
    <span class="n">self</span><span class="p">.</span><span class="n">prefix</span><span class="p">,</span>
<span class="p">)</span>
</code></pre></div></div>

<p>After:</p>

<div class="language-python highlighter-rouge"><div class="highlight"><pre class="highlight"><code><span class="n">mixed_qkvz</span><span class="p">,</span> <span class="n">_</span> <span class="o">=</span> <span class="n">self</span><span class="p">.</span><span class="nf">in_proj_qkvz</span><span class="p">(</span><span class="n">hidden_states</span><span class="p">)</span>
<span class="n">ba</span><span class="p">,</span> <span class="n">_</span> <span class="o">=</span> <span class="n">self</span><span class="p">.</span><span class="nf">in_proj_ba</span><span class="p">(</span><span class="n">hidden_states</span><span class="p">)</span>
</code></pre></div></div>

<p>The removed custom op wasn’t just a convenience wrapper. It dispatched the two projection GEMMs on <strong>two parallel CUDA streams</strong>, overlapping them. The replacement runs them <strong>sequentially</strong> on the default stream. Every GDN layer, every decode step, pays twice the launch latency and loses the overlap.</p>

<p>PR #38152’s own description is unusually candid about the reason:</p>

<blockquote>
  <p>Currently dual stream execution requires custom ops that pass the layer_name as a string. This will regress cold compile times by ~4x. So this PR temporarily reverts dual stream optimization in Qwen3 and Qwen3.5 models.</p>

  <p>TODO: Re-enable dual stream after #38123 and upgrade to Pytorch 2.11.</p>
</blockquote>

<p>So this wasn’t a correctness fix or a cleanup. It was a <strong>deliberate runtime-perf regression accepted to fix a compile-time regression</strong>. That is a reasonable call when the alternative is four-times-longer cold starts in CI — but the tradeoff lands on every Qwen3/Qwen3.5 user served from a nightly between the revert and whatever future torch 2.11 + #38123 combo re-enables the optimization.</p>

<h2 id="why-it-matters-more-on-this-model-than-youd-think">Why it matters more on this model than you’d think</h2>

<p>Qwen3.5-35B-A3B is a hybrid. Not every layer is GDN; many are vanilla attention over an MoE. But the GDN blocks are on the critical path of every decode step, and the input projection runs once per block per token. Removing the parallel-stream dispatch means dozens of additional serial waits per generated token. At 183 tok/s versus 198 tok/s, a decode step is roughly 5.0 ms versus 5.5 ms — the 0.5 ms delta is entirely credible as stream-serialization overhead across a hybrid model’s GDN layers.</p>

<p>The other two suspect commits probably aren’t innocent — <code class="language-plaintext highlighter-rouge">b779eb336</code>’s “simplify warmup to single pass” could be choosing worse autotuner configs, and the GDN refactor might have introduced a small per-step Python cost — but they are orders of magnitude smaller contributors than the dual-stream revert.</p>

<h2 id="what-to-do-about-it">What to do about it</h2>

<p>Three options, cheapest first.</p>

<p><strong>Pin the image.</strong> If you aren’t chasing a specific new feature, <code class="language-plaintext highlighter-rouge">vllm/vllm-openai@sha256:923cbdaf…</code> (cu130-nightly-mar23) gives the faster decode path today. The sibling container already does this and it’s why it’s faster.</p>

<p><strong>Overlay the revert-of-the-revert.</strong> vLLM’s model files are pure Python. A five-line file overlay that restores the <code class="language-plaintext highlighter-rouge">torch.ops.vllm.gdn_in_proj</code> branch in <code class="language-plaintext highlighter-rouge">qwen3_5.py</code> (and its <code class="language-plaintext highlighter-rouge">qwen3_next.py</code> twin) gives a recent nightly the old speed back, at the cost of the compile-time regression that motivated #38152 — perfectly fine for a long-running serving deployment, painful for CI.</p>

<p><strong>Wait.</strong> #38152’s TODO is real. Once vLLM’s plumbing (#38123) and PyTorch 2.11’s compile infrastructure land, dual-stream execution should come back without the compile-time penalty. That’s the clean fix and the one you want if you don’t need the speed back this week.</p>

<h2 id="takeaways">Takeaways</h2>

<p>Two lessons worth writing down.</p>

<p>First, nightly “slower than it was last month” is not always a phantom. Docker image tags are moving targets and two builds can legitimately diverge by 8% on the exact same GPU, driver, and command line. Pin something you trust and diff against it.</p>

<p>Second, performance regressions often look like tradeoffs, not bugs. #38152 is honest about what it is — a cold-start fix that gives back some hot-path throughput. The signal isn’t “somebody broke decode.” The signal is “somebody accepted a tax on decode to pay a bigger bill elsewhere.” Finding these requires reading the PR body, not just the diff.</p>

<p>The code is the same. The speed is different. The difference is a decision.</p>]]></content><author><name>Jim Smith</name></author><category term="AI Technology" /><category term="vllm" /><category term="qwen" /><category term="blackwell" /><category term="nightly" /><category term="regression" /><category term="performance" /><category term="local-llm" /><summary type="html"><![CDATA[How a controlled bisection traced an 8% Qwen3.5-35B decode slowdown to PR #38152 — a deliberate runtime regression accepted to fix a 4x cold-compile-time hit.]]></summary></entry></feed>